29
/
en
AIzaSyAYiBZKx7MnpbEhh9jyipgxe19OcubqV5w
April 1, 2024
193461
Mauritania
MRT
true
2
1
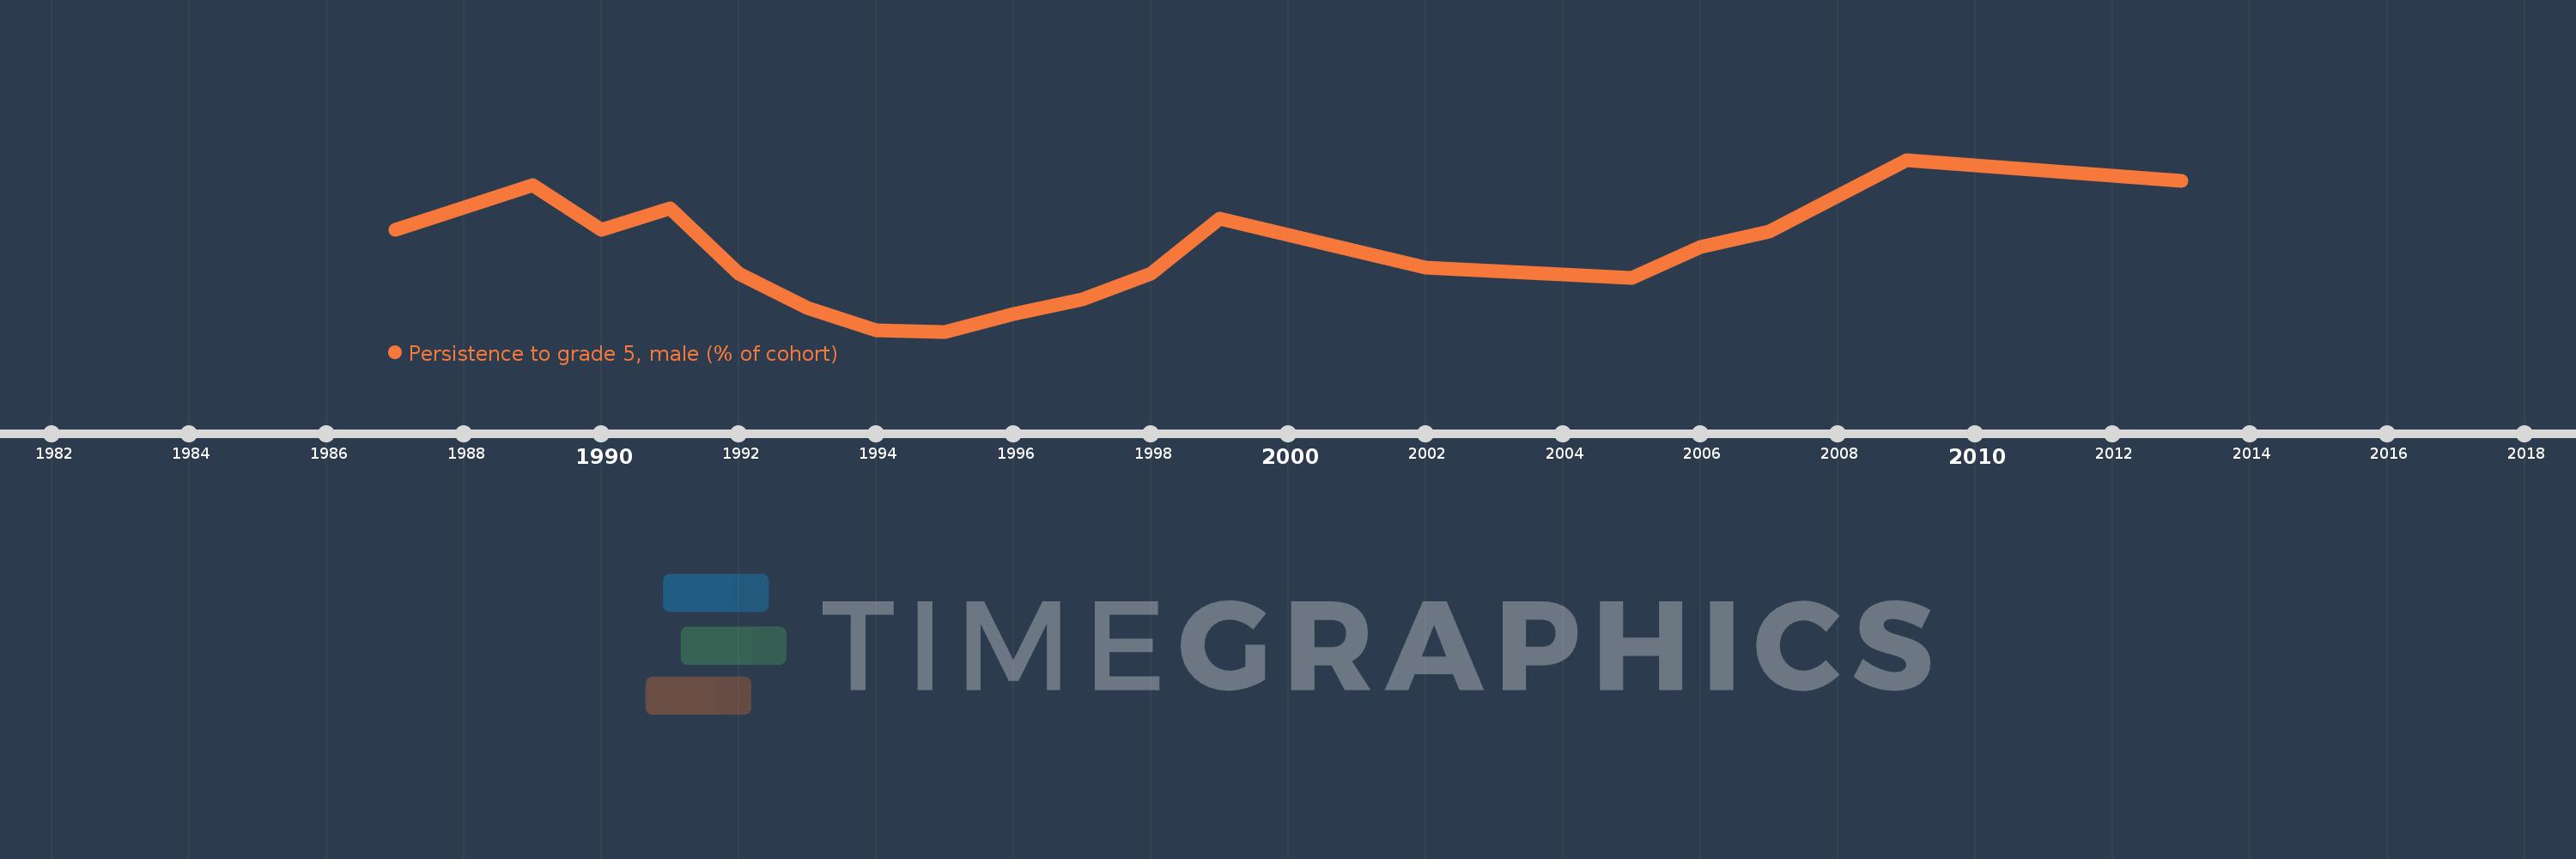
Persistence to grade 5, male (% of cohort)
2013,2009,2007,2006,2005,2002,1999,1998,1997,1996,1995,1994,1993,1992,1991,1990,1989,1987
This statistics in other country:
AfghanistanAlbaniaAlgeriaAndorraAngolaAntigua and BarbudaArab WorldArgentinaArubaBahamas, TheBahrainBangladeshBarbadosBelgiumBelizeBeninBermudaBhutanBoliviaBosnia and HerzegovinaBotswanaBrunei DarussalamBurkina FasoBurundiCabo VerdeCambodiaCameroonCanadaCaribbean small statesCayman IslandsCentral African RepublicChadChileChinaColombiaComorosCongo, Dem. Rep.Congo, Rep.Costa RicaCote d'IvoireCubaCyprusCzech RepublicDenmarkDjiboutiDominicaDominican RepublicEarly-demographic dividendEast Asia & PacificEast Asia & Pacific (excluding high income)East Asia & Pacific (IDA & IBRD countries)EcuadorEgypt, Arab Rep.El SalvadorEquatorial GuineaEritreaEstoniaEthiopiaFijiFinlandFranceGabonGambia, TheGeorgiaGhanaGreeceGrenadaGuatemalaGuineaGuinea-BissauGuyanaHaitiHeavily indebted poor countries (HIPC)HondurasHong Kong SAR, ChinaHungaryIcelandIDA blendIDA onlyIDA totalIndiaIndonesiaIran, Islamic Rep.IraqIrelandIsraelItalyJamaicaJapanJordanKenyaKiribatiKorea, Rep.KuwaitLao PDRLate-demographic dividendLatviaLeast developed countries: UN classificationLebanonLesothoLiberiaLibyaLiechtensteinLow incomeLower middle incomeLuxembourgMacao SAR, ChinaMadagascarMalawiMalaysiaMaldivesMaliMaltaMarshall IslandsMauritaniaMauritiusMexicoMiddle East & North AfricaMiddle East & North Africa (excluding high income)Middle East & North Africa (IDA & IBRD countries)MontenegroMoroccoMozambiqueMyanmarNamibiaNepalNetherlandsNicaraguaNigerNigeriaNorwayOmanOther small statesPacific island small statesPakistanPanamaPapua New GuineaParaguayPeruPhilippinesPolandPortugalPre-demographic dividendQatarRwandaSamoaSan MarinoSao Tome and PrincipeSaudi ArabiaSenegalSeychellesSierra LeoneSingaporeSloveniaSolomon IslandsSouth AfricaSouth AsiaSouth Asia (IDA & IBRD)SpainSri LankaSt. Kitts and NevisSt. LuciaSt. Vincent and the GrenadinesSub-Saharan Africa Sub-Saharan Africa (excluding high income)Sub-Saharan Africa (IDA & IBRD countries)SudanSurinameSwazilandSwedenSwitzerlandSyrian Arab RepublicTanzaniaThailandTimor-LesteTogoTongaTrinidad and TobagoTunisiaTurkeyUgandaUnited Arab EmiratesUpper middle incomeUruguayVanuatuVenezuela, RBVietnamYemen, Rep.ZambiaZimbabwe Timeline:
This timeline shows a graph from 1987 to 2013 of Mauritania. No data until 1986. Number of actual observations by date: 18.
Source name:
World Development Indicators
Source organization:
United Nations Educational, Scientific, and Cultural Organization (UNESCO) Institute for Statistics.
Categories, topics:
Education, Gender
Last updated:
apr 23, 2017
Indicators value changes by year
Minimum:
37.769
jan 1, 1995
Maximum:
80.466
jan 1, 2009
At the date of observation
Value
Absolute change
Change from previous value
jan 1, 1987
63.069
+63.069
0.0%
jan 1, 1989
74.09
+11.021
17.47%
jan 1, 1990
63.169
-10.921
-14.74%
jan 1, 1991
68.458
+5.289
8.37%
jan 1, 1992
52.097
-16.361
-23.9%
jan 1, 1993
43.557
-8.54
-16.39%
jan 1, 1994
38.101
-5.456
-12.53%
jan 1, 1995
37.769
-0.333
-0.87%
jan 1, 1996
42.122
+4.353
11.53%
jan 1, 1997
45.876
+3.754
8.91%
jan 1, 1998
52.226
+6.35
13.84%
jan 1, 1999
65.927
+13.701
26.23%
jan 1, 2002
53.676
-12.251
-18.58%
jan 1, 2005
51.093
-2.582
-4.81%
jan 1, 2006
58.702
+7.609
14.89%
jan 1, 2007
62.554
+3.851
6.56%
jan 1, 2009
80.466
+17.912
28.63%
jan 1, 2013
75.314
-5.152
-6.4%
Ranking of countries by current statistics by years


Comments: