29
/
en
AIzaSyAYiBZKx7MnpbEhh9jyipgxe19OcubqV5w
April 1, 2024
227772
Qatar
QAT
true
2
1
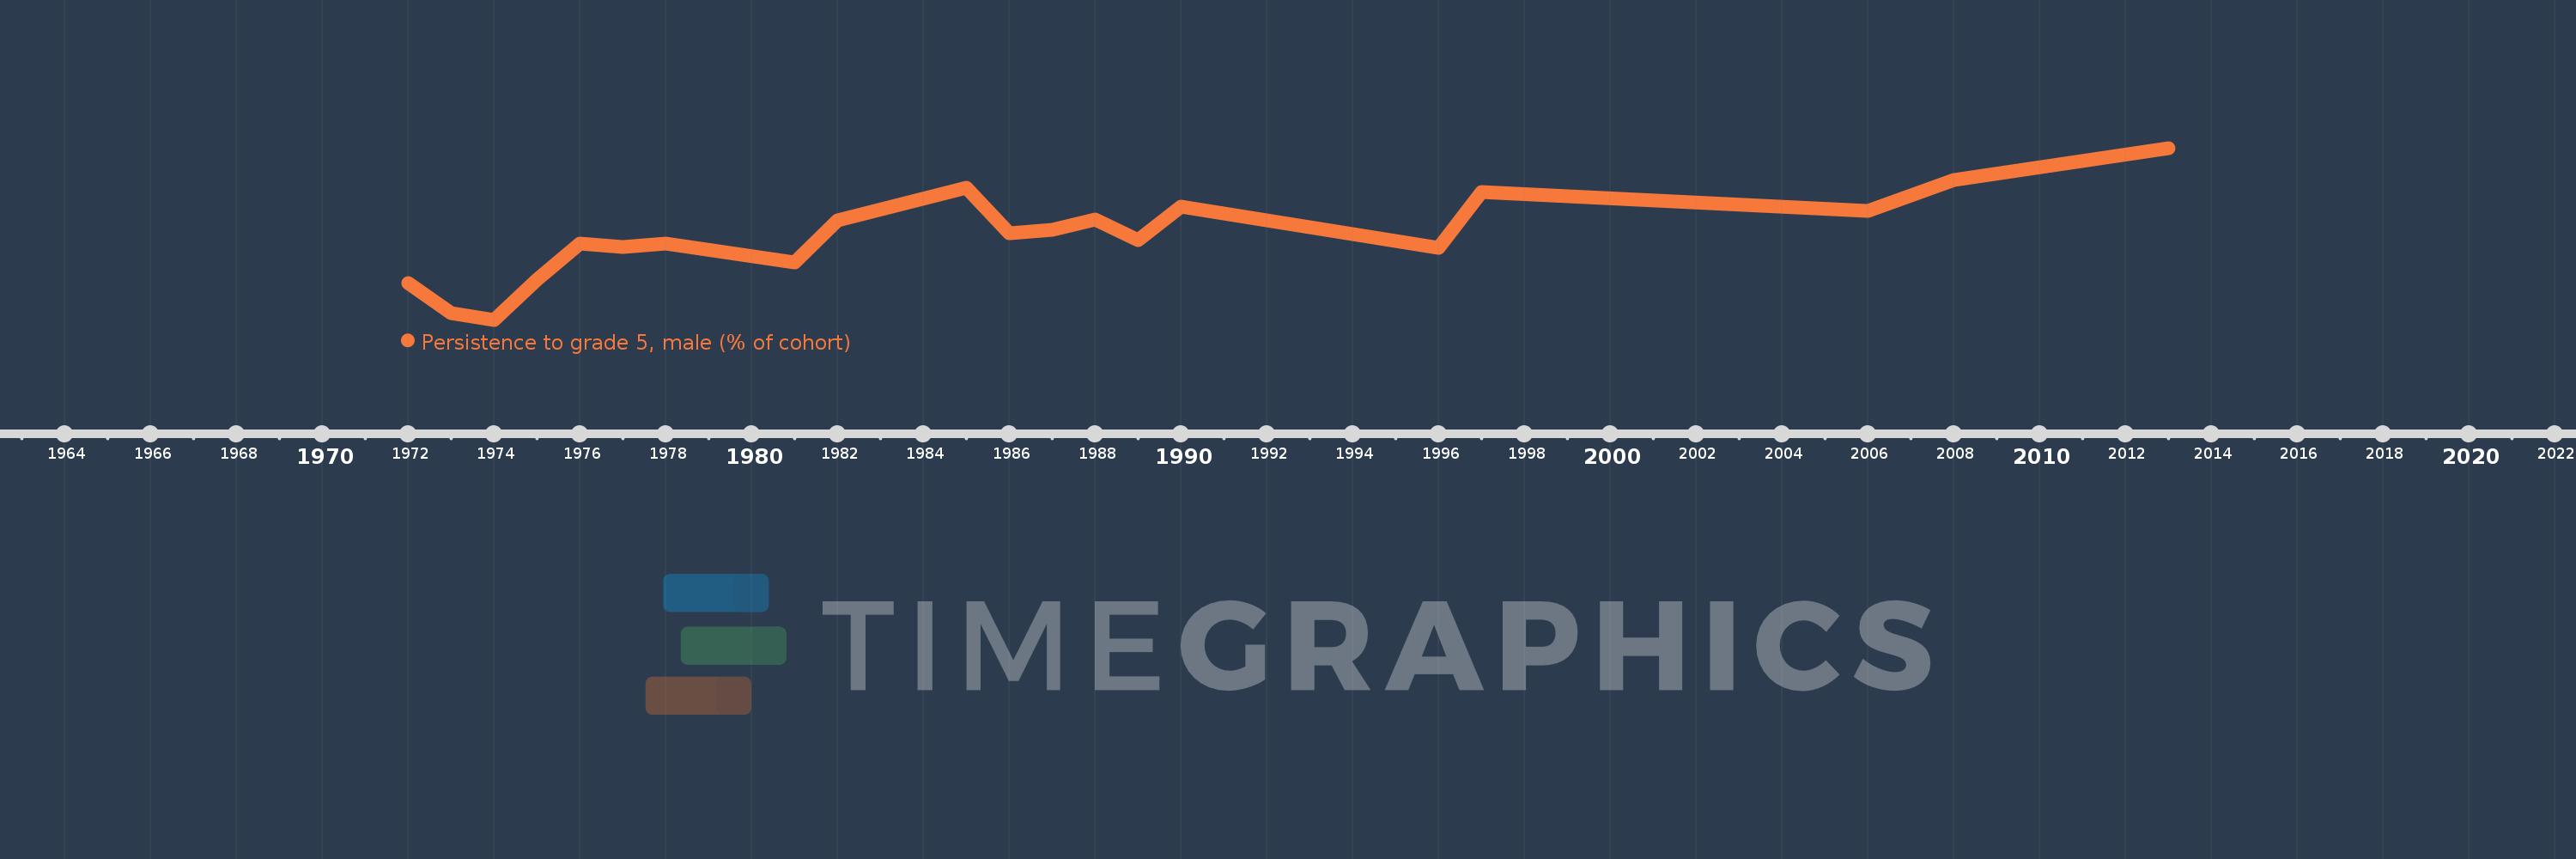
Persistence to grade 5, male (% of cohort)
2013,2008,2006,1997,1996,1990,1989,1988,1987,1986,1985,1982,1981,1978,1977,1976,1975,1974,1973,1972
This statistics in other country:
AfghanistanAlbaniaAlgeriaAndorraAngolaAntigua and BarbudaArab WorldArgentinaArubaBahamas, TheBahrainBangladeshBarbadosBelgiumBelizeBeninBermudaBhutanBoliviaBosnia and HerzegovinaBotswanaBrunei DarussalamBurkina FasoBurundiCabo VerdeCambodiaCameroonCanadaCaribbean small statesCayman IslandsCentral African RepublicChadChileChinaColombiaComorosCongo, Dem. Rep.Congo, Rep.Costa RicaCote d'IvoireCubaCyprusCzech RepublicDenmarkDjiboutiDominicaDominican RepublicEarly-demographic dividendEast Asia & PacificEast Asia & Pacific (excluding high income)East Asia & Pacific (IDA & IBRD countries)EcuadorEgypt, Arab Rep.El SalvadorEquatorial GuineaEritreaEstoniaEthiopiaFijiFinlandFranceGabonGambia, TheGeorgiaGhanaGreeceGrenadaGuatemalaGuineaGuinea-BissauGuyanaHaitiHeavily indebted poor countries (HIPC)HondurasHong Kong SAR, ChinaHungaryIcelandIDA blendIDA onlyIDA totalIndiaIndonesiaIran, Islamic Rep.IraqIrelandIsraelItalyJamaicaJapanJordanKenyaKiribatiKorea, Rep.KuwaitLao PDRLate-demographic dividendLatviaLeast developed countries: UN classificationLebanonLesothoLiberiaLibyaLiechtensteinLow incomeLower middle incomeLuxembourgMacao SAR, ChinaMadagascarMalawiMalaysiaMaldivesMaliMaltaMarshall IslandsMauritaniaMauritiusMexicoMiddle East & North AfricaMiddle East & North Africa (excluding high income)Middle East & North Africa (IDA & IBRD countries)MontenegroMoroccoMozambiqueMyanmarNamibiaNepalNetherlandsNicaraguaNigerNigeriaNorwayOmanOther small statesPacific island small statesPakistanPanamaPapua New GuineaParaguayPeruPhilippinesPolandPortugalPre-demographic dividendQatarRwandaSamoaSan MarinoSao Tome and PrincipeSaudi ArabiaSenegalSeychellesSierra LeoneSingaporeSloveniaSolomon IslandsSouth AfricaSouth AsiaSouth Asia (IDA & IBRD)SpainSri LankaSt. Kitts and NevisSt. LuciaSt. Vincent and the GrenadinesSub-Saharan Africa Sub-Saharan Africa (excluding high income)Sub-Saharan Africa (IDA & IBRD countries)SudanSurinameSwazilandSwedenSwitzerlandSyrian Arab RepublicTanzaniaThailandTimor-LesteTogoTongaTrinidad and TobagoTunisiaTurkeyUgandaUnited Arab EmiratesUpper middle incomeUruguayVanuatuVenezuela, RBVietnamYemen, Rep.ZambiaZimbabwe Timeline:
This timeline shows a graph from 1972 to 2013 of Qatar. No data until 1971. Number of actual observations by date: 20.
Source name:
World Development Indicators
Source organization:
United Nations Educational, Scientific, and Cultural Organization (UNESCO) Institute for Statistics.
Categories, topics:
Education, Gender
Last updated:
apr 23, 2017
Indicators value changes by year
Maximum:
99.278
jan 1, 2013
At the date of observation
Value
Absolute change
Change from previous value
jan 1, 1972
69.399
+69.399
0.0%
jan 1, 1973
62.903
-6.496
-9.36%
jan 1, 1974
61.35
-1.553
-2.47%
jan 1, 1975
70.138
+8.788
14.32%
jan 1, 1976
78.161
+8.022
11.44%
jan 1, 1977
77.49
-0.671
-0.86%
jan 1, 1978
78.093
+0.603
0.78%
jan 1, 1981
74.085
-4.008
-5.13%
jan 1, 1982
83.373
+9.288
12.54%
jan 1, 1985
90.494
+7.121
8.54%
jan 1, 1986
80.54
-9.954
-11.0%
jan 1, 1987
81.194
+0.654
0.81%
jan 1, 1988
83.401
+2.207
2.72%
jan 1, 1989
78.916
-4.485
-5.38%
jan 1, 1990
86.251
+7.335
9.29%
jan 1, 1996
77.171
-9.08
-10.53%
jan 1, 1997
89.61
+12.439
16.12%
jan 1, 2006
85.372
-4.238
-4.73%
jan 1, 2008
92.286
+6.914
8.1%
jan 1, 2013
99.278
+6.992
7.58%
Ranking of countries by current statistics by years


Comments: