29
/
en
AIzaSyAYiBZKx7MnpbEhh9jyipgxe19OcubqV5w
April 1, 2024
275127
United Arab Emirates
ARE
true
2
1
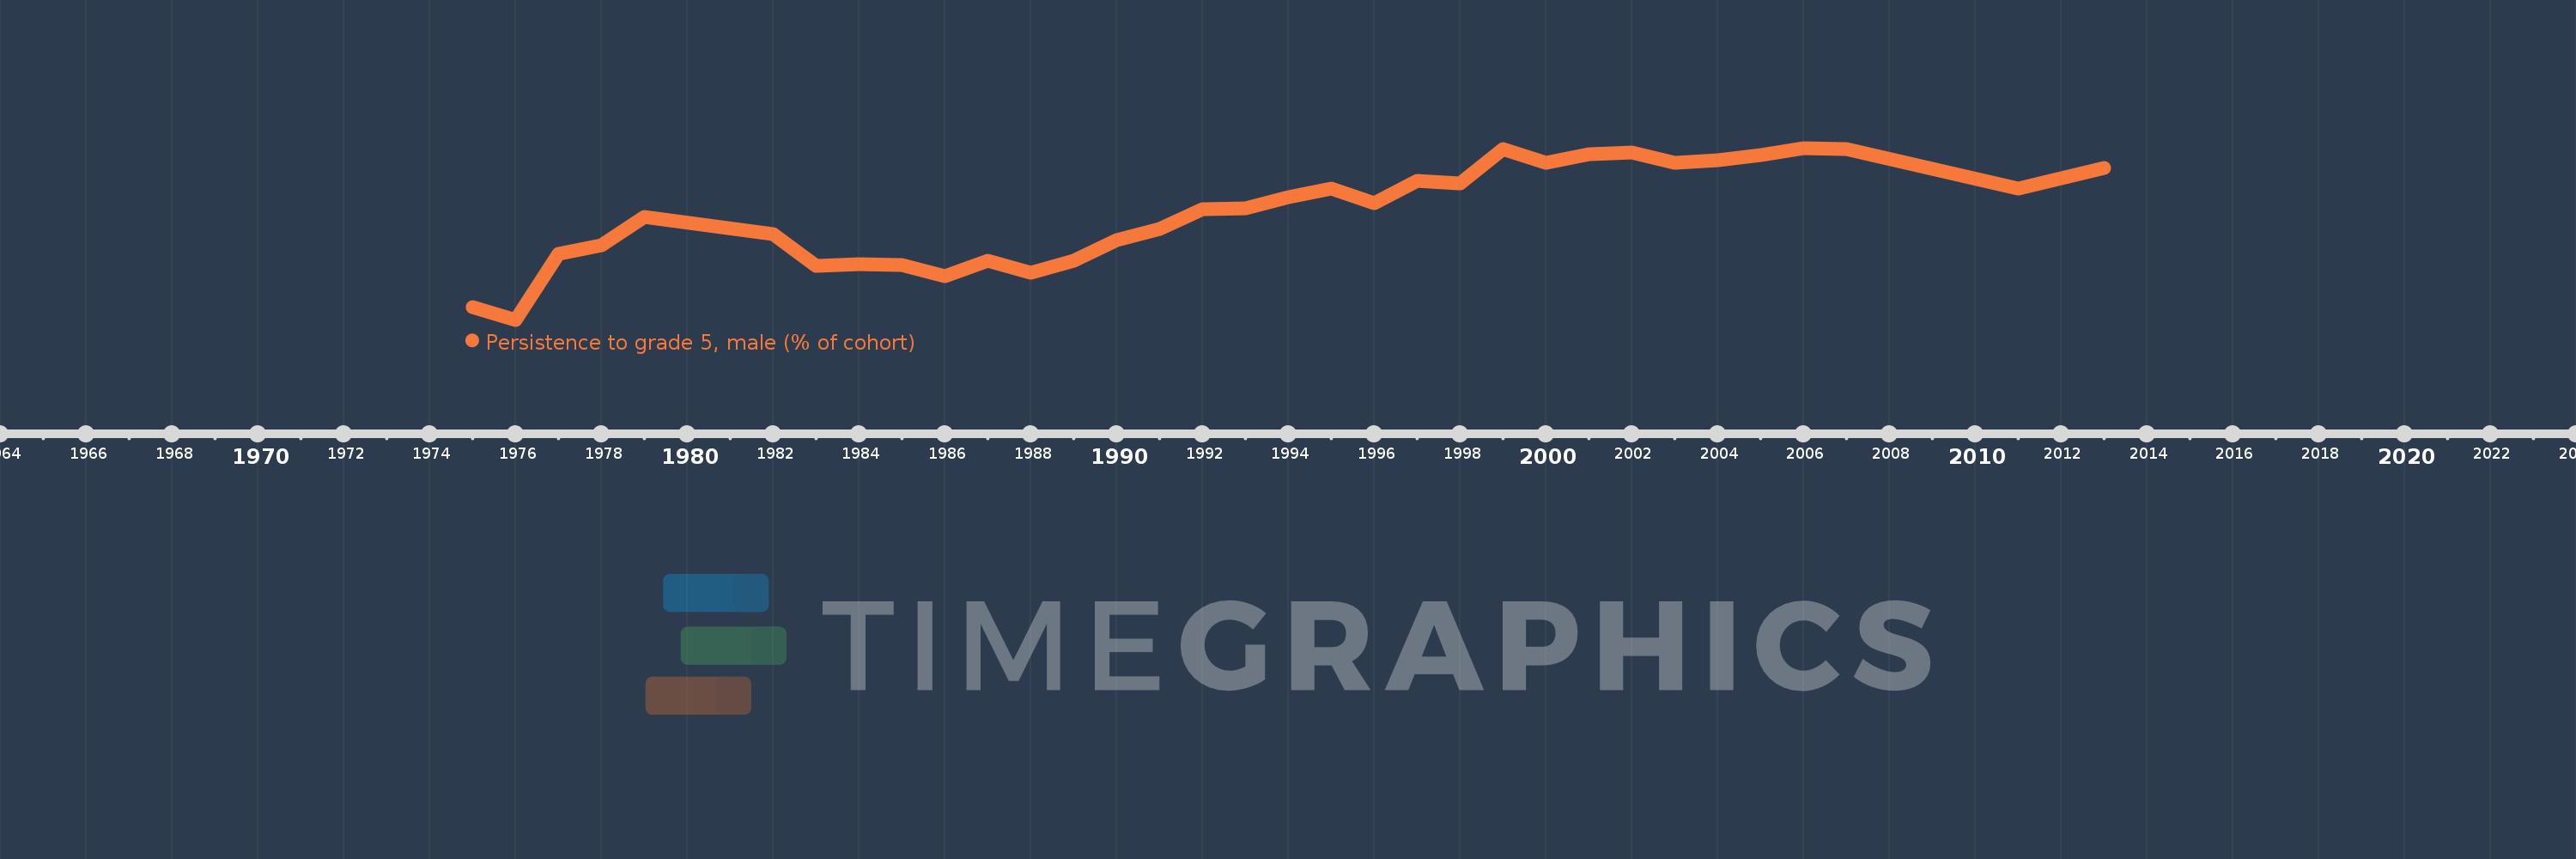
Persistence to grade 5, male (% of cohort)
2013,2011,2007,2006,2005,2004,2003,2002,2001,2000,1999,1998,1997,1996,1995,1994,1993,1992,1991,1990,1989,1988,1987,1986,1985,1984,1983,1982,1979,1978,1977,1976,1975
This statistics in other country:
AfghanistanAlbaniaAlgeriaAndorraAngolaAntigua and BarbudaArab WorldArgentinaArubaBahamas, TheBahrainBangladeshBarbadosBelgiumBelizeBeninBermudaBhutanBoliviaBosnia and HerzegovinaBotswanaBrunei DarussalamBurkina FasoBurundiCabo VerdeCambodiaCameroonCanadaCaribbean small statesCayman IslandsCentral African RepublicChadChileChinaColombiaComorosCongo, Dem. Rep.Congo, Rep.Costa RicaCote d'IvoireCubaCyprusCzech RepublicDenmarkDjiboutiDominicaDominican RepublicEarly-demographic dividendEast Asia & PacificEast Asia & Pacific (excluding high income)East Asia & Pacific (IDA & IBRD countries)EcuadorEgypt, Arab Rep.El SalvadorEquatorial GuineaEritreaEstoniaEthiopiaFijiFinlandFranceGabonGambia, TheGeorgiaGhanaGreeceGrenadaGuatemalaGuineaGuinea-BissauGuyanaHaitiHeavily indebted poor countries (HIPC)HondurasHong Kong SAR, ChinaHungaryIcelandIDA blendIDA onlyIDA totalIndiaIndonesiaIran, Islamic Rep.IraqIrelandIsraelItalyJamaicaJapanJordanKenyaKiribatiKorea, Rep.KuwaitLao PDRLate-demographic dividendLatviaLeast developed countries: UN classificationLebanonLesothoLiberiaLibyaLiechtensteinLow incomeLower middle incomeLuxembourgMacao SAR, ChinaMadagascarMalawiMalaysiaMaldivesMaliMaltaMarshall IslandsMauritaniaMauritiusMexicoMiddle East & North AfricaMiddle East & North Africa (excluding high income)Middle East & North Africa (IDA & IBRD countries)MontenegroMoroccoMozambiqueMyanmarNamibiaNepalNetherlandsNicaraguaNigerNigeriaNorwayOmanOther small statesPacific island small statesPakistanPanamaPapua New GuineaParaguayPeruPhilippinesPolandPortugalPre-demographic dividendQatarRwandaSamoaSan MarinoSao Tome and PrincipeSaudi ArabiaSenegalSeychellesSierra LeoneSingaporeSloveniaSolomon IslandsSouth AfricaSouth AsiaSouth Asia (IDA & IBRD)SpainSri LankaSt. Kitts and NevisSt. LuciaSt. Vincent and the GrenadinesSub-Saharan Africa Sub-Saharan Africa (excluding high income)Sub-Saharan Africa (IDA & IBRD countries)SudanSurinameSwazilandSwedenSwitzerlandSyrian Arab RepublicTanzaniaThailandTimor-LesteTogoTongaTrinidad and TobagoTunisiaTurkeyUgandaUnited Arab EmiratesUpper middle incomeUruguayVanuatuVenezuela, RBVietnamYemen, Rep.ZambiaZimbabwe Timeline:
This timeline shows a graph from 1975 to 2013 of United Arab Emirates. No data until 1974. Number of actual observations by date: 33.
Source name:
World Development Indicators
Source organization:
United Nations Educational, Scientific, and Cultural Organization (UNESCO) Institute for Statistics.
Categories, topics:
Education, Gender
Last updated:
apr 23, 2017
Indicators value changes by year
Minimum:
44.105
jan 1, 1976
At the date of observation
Value
Absolute change
Change from previous value
jan 1, 1975
47.88
+47.88
0.0%
jan 1, 1976
44.105
-3.775
-7.89%
jan 1, 1977
64.295
+20.19
45.78%
jan 1, 1978
67.069
+2.774
4.31%
jan 1, 1979
75.822
+8.753
13.05%
jan 1, 1982
70.544
-5.278
-6.96%
jan 1, 1983
60.594
-9.95
-14.1%
jan 1, 1984
61.285
+0.691
1.14%
jan 1, 1985
61.06
-0.225
-0.37%
jan 1, 1986
57.481
-3.578
-5.86%
jan 1, 1987
62.298
+4.817
8.38%
jan 1, 1988
58.639
-3.659
-5.87%
jan 1, 1989
62.286
+3.647
6.22%
jan 1, 1990
68.684
+6.399
10.27%
jan 1, 1991
72.121
+3.437
5.0%
jan 1, 1992
78.261
+6.14
8.51%
jan 1, 1993
78.407
+0.146
0.19%
jan 1, 1994
81.947
+3.54
4.51%
jan 1, 1995
84.447
+2.5
3.05%
jan 1, 1996
80.03
-4.417
-5.23%
jan 1, 1997
86.822
+6.793
8.49%
jan 1, 1998
86.04
-0.783
-0.9%
jan 1, 1999
96.771
+10.732
12.47%
jan 1, 2000
92.546
-4.225
-4.37%
jan 1, 2001
95.067
+2.521
2.72%
jan 1, 2002
95.575
+0.508
0.53%
jan 1, 2003
92.53
-3.045
-3.19%
jan 1, 2004
93.353
+0.823
0.89%
jan 1, 2005
94.91
+1.557
1.67%
jan 1, 2006
97.07
+2.159
2.28%
jan 1, 2007
96.644
-0.425
-0.44%
jan 1, 2011
84.549
-12.095
-12.51%
jan 1, 2013
90.817
+6.267
7.41%
Ranking of countries by current statistics by years


Comments: