29
/
en
AIzaSyAYiBZKx7MnpbEhh9jyipgxe19OcubqV5w
April 1, 2024
114060
Cote d'Ivoire
CIV
true
2
1
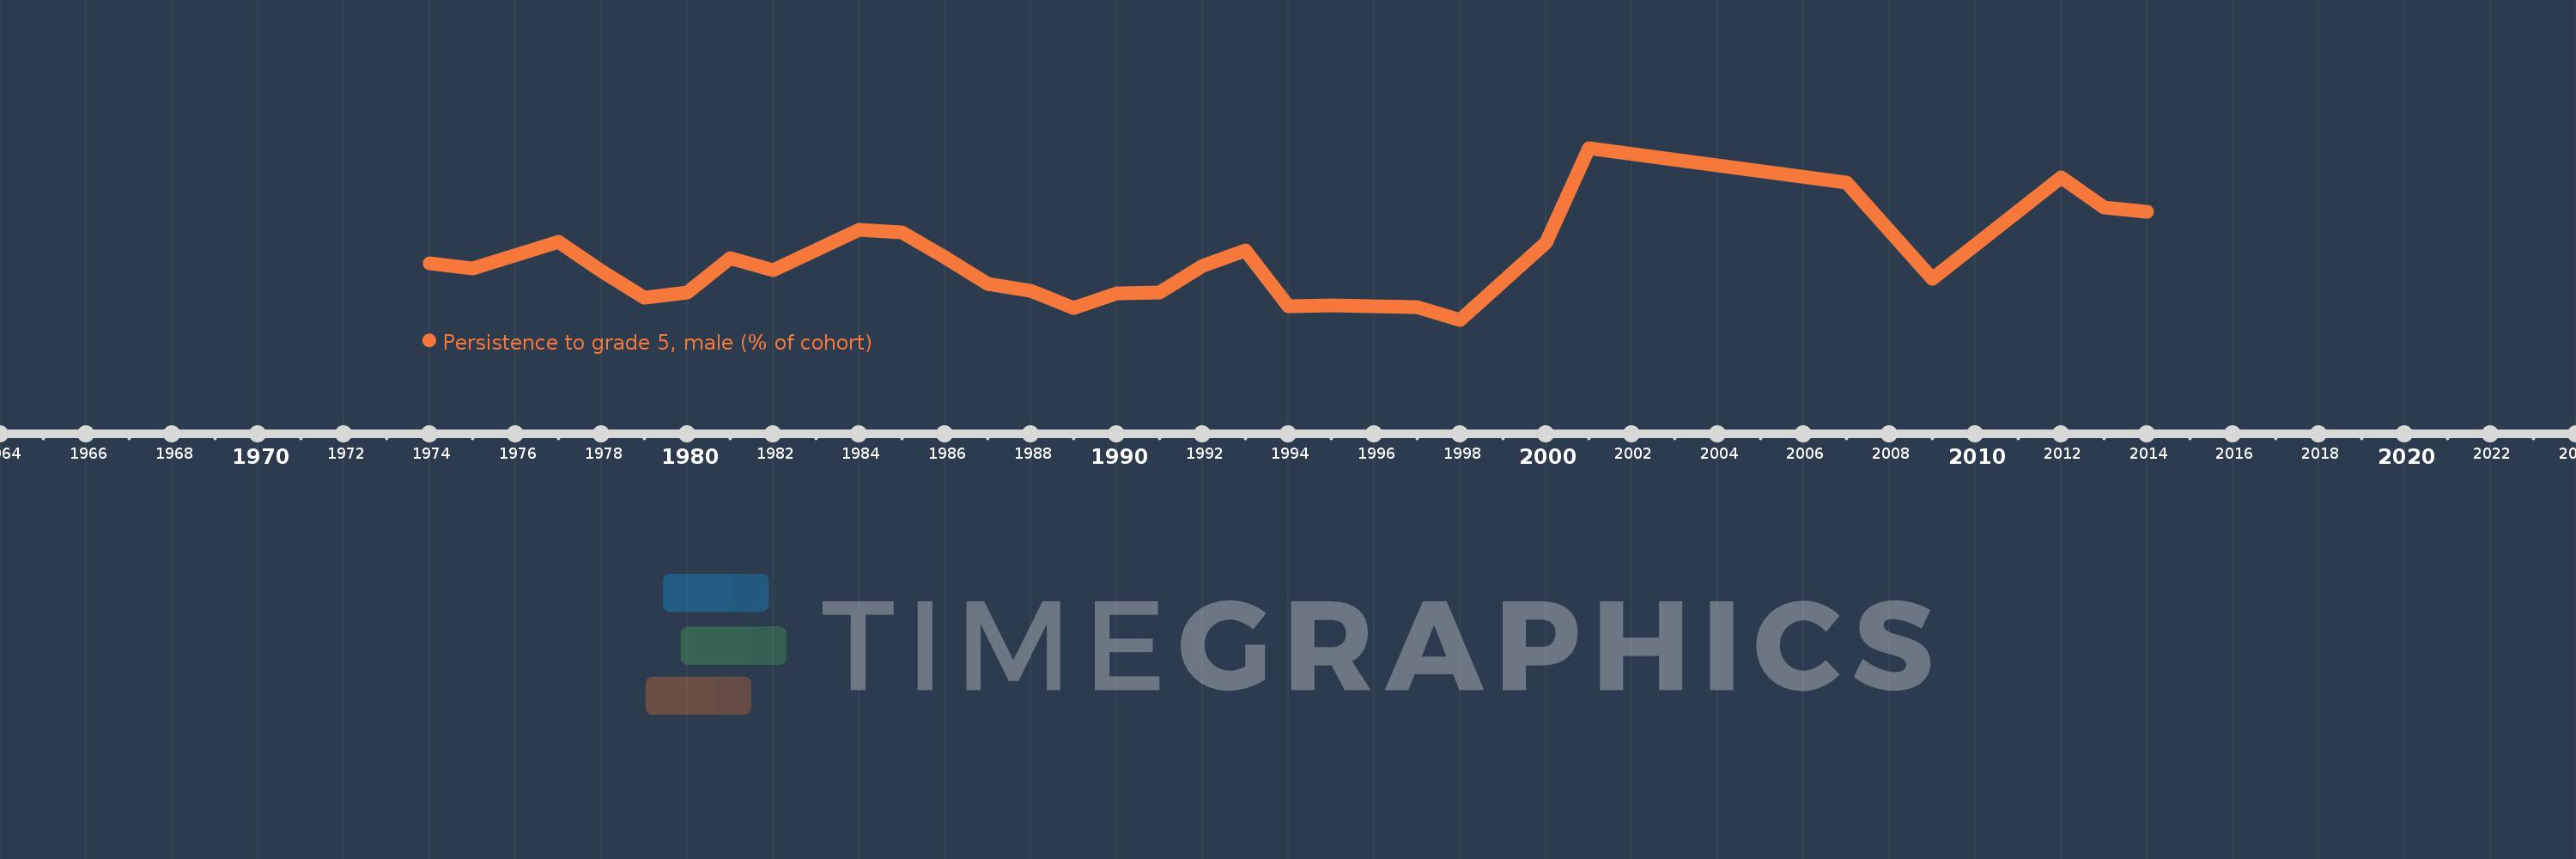
Persistence to grade 5, male (% of cohort)
2014,2013,2012,2009,2007,2001,2000,1998,1997,1996,1995,1994,1993,1992,1991,1990,1989,1988,1987,1986,1985,1984,1982,1981,1980,1979,1978,1977,1975,1974
This statistics in other country:
AfghanistanAlbaniaAlgeriaAndorraAngolaAntigua and BarbudaArab WorldArgentinaArubaBahamas, TheBahrainBangladeshBarbadosBelgiumBelizeBeninBermudaBhutanBoliviaBosnia and HerzegovinaBotswanaBrunei DarussalamBurkina FasoBurundiCabo VerdeCambodiaCameroonCanadaCaribbean small statesCayman IslandsCentral African RepublicChadChileChinaColombiaComorosCongo, Dem. Rep.Congo, Rep.Costa RicaCote d'IvoireCubaCyprusCzech RepublicDenmarkDjiboutiDominicaDominican RepublicEarly-demographic dividendEast Asia & PacificEast Asia & Pacific (excluding high income)East Asia & Pacific (IDA & IBRD countries)EcuadorEgypt, Arab Rep.El SalvadorEquatorial GuineaEritreaEstoniaEthiopiaFijiFinlandFranceGabonGambia, TheGeorgiaGhanaGreeceGrenadaGuatemalaGuineaGuinea-BissauGuyanaHaitiHeavily indebted poor countries (HIPC)HondurasHong Kong SAR, ChinaHungaryIcelandIDA blendIDA onlyIDA totalIndiaIndonesiaIran, Islamic Rep.IraqIrelandIsraelItalyJamaicaJapanJordanKenyaKiribatiKorea, Rep.KuwaitLao PDRLate-demographic dividendLatviaLeast developed countries: UN classificationLebanonLesothoLiberiaLibyaLiechtensteinLow incomeLower middle incomeLuxembourgMacao SAR, ChinaMadagascarMalawiMalaysiaMaldivesMaliMaltaMarshall IslandsMauritaniaMauritiusMexicoMiddle East & North AfricaMiddle East & North Africa (excluding high income)Middle East & North Africa (IDA & IBRD countries)MontenegroMoroccoMozambiqueMyanmarNamibiaNepalNetherlandsNicaraguaNigerNigeriaNorwayOmanOther small statesPacific island small statesPakistanPanamaPapua New GuineaParaguayPeruPhilippinesPolandPortugalPre-demographic dividendQatarRwandaSamoaSan MarinoSao Tome and PrincipeSaudi ArabiaSenegalSeychellesSierra LeoneSingaporeSloveniaSolomon IslandsSouth AfricaSouth AsiaSouth Asia (IDA & IBRD)SpainSri LankaSt. Kitts and NevisSt. LuciaSt. Vincent and the GrenadinesSub-Saharan Africa Sub-Saharan Africa (excluding high income)Sub-Saharan Africa (IDA & IBRD countries)SudanSurinameSwazilandSwedenSwitzerlandSyrian Arab RepublicTanzaniaThailandTimor-LesteTogoTongaTrinidad and TobagoTunisiaTurkeyUgandaUnited Arab EmiratesUpper middle incomeUruguayVanuatuVenezuela, RBVietnamYemen, Rep.ZambiaZimbabwe Timeline:
This timeline shows a graph from 1974 to 2014 of Cote d'Ivoire. No data until 1973. Number of actual observations by date: 30.
Source name:
World Development Indicators
Source organization:
United Nations Educational, Scientific, and Cultural Organization (UNESCO) Institute for Statistics.
Categories, topics:
Education, Gender
Last updated:
apr 23, 2017
Indicators value changes by year
Minimum:
58.627
jan 1, 1998
Maximum:
89.709
jan 1, 2001
At the date of observation
Value
Absolute change
Change from previous value
jan 1, 1974
68.775
+68.775
0.0%
jan 1, 1975
67.972
-0.803
-1.17%
jan 1, 1977
72.694
+4.722
6.95%
jan 1, 1978
67.457
-5.237
-7.2%
jan 1, 1979
62.618
-4.839
-7.17%
jan 1, 1980
63.574
+0.956
1.53%
jan 1, 1981
69.713
+6.14
9.66%
jan 1, 1982
67.621
-2.092
-3.0%
jan 1, 1984
74.882
+7.261
10.74%
jan 1, 1985
74.383
-0.499
-0.67%
jan 1, 1986
69.941
-4.441
-5.97%
jan 1, 1987
65.108
-4.834
-6.91%
jan 1, 1988
63.926
-1.182
-1.81%
jan 1, 1989
60.739
-3.187
-4.99%
jan 1, 1990
63.389
+2.65
4.36%
jan 1, 1991
63.617
+0.228
0.36%
jan 1, 1992
68.432
+4.815
7.57%
jan 1, 1993
71.144
+2.712
3.96%
jan 1, 1994
61.064
-10.08
-14.17%
jan 1, 1995
61.284
+0.22
0.36%
jan 1, 1996
61.143
-0.141
-0.23%
jan 1, 1997
60.904
-0.239
-0.39%
jan 1, 1998
58.627
-2.278
-3.74%
jan 1, 2000
72.546
+13.919
23.74%
jan 1, 2001
89.709
+17.163
23.66%
jan 1, 2007
83.372
-6.337
-7.06%
jan 1, 2009
66.041
-17.331
-20.79%
jan 1, 2012
84.347
+18.306
27.72%
jan 1, 2013
78.948
-5.399
-6.4%
jan 1, 2014
78.209
-0.74
-0.94%
Ranking of countries by current statistics by years


Comments: