29
/
en
AIzaSyAYiBZKx7MnpbEhh9jyipgxe19OcubqV5w
April 1, 2024
126672
El Salvador
SLV
true
2
1
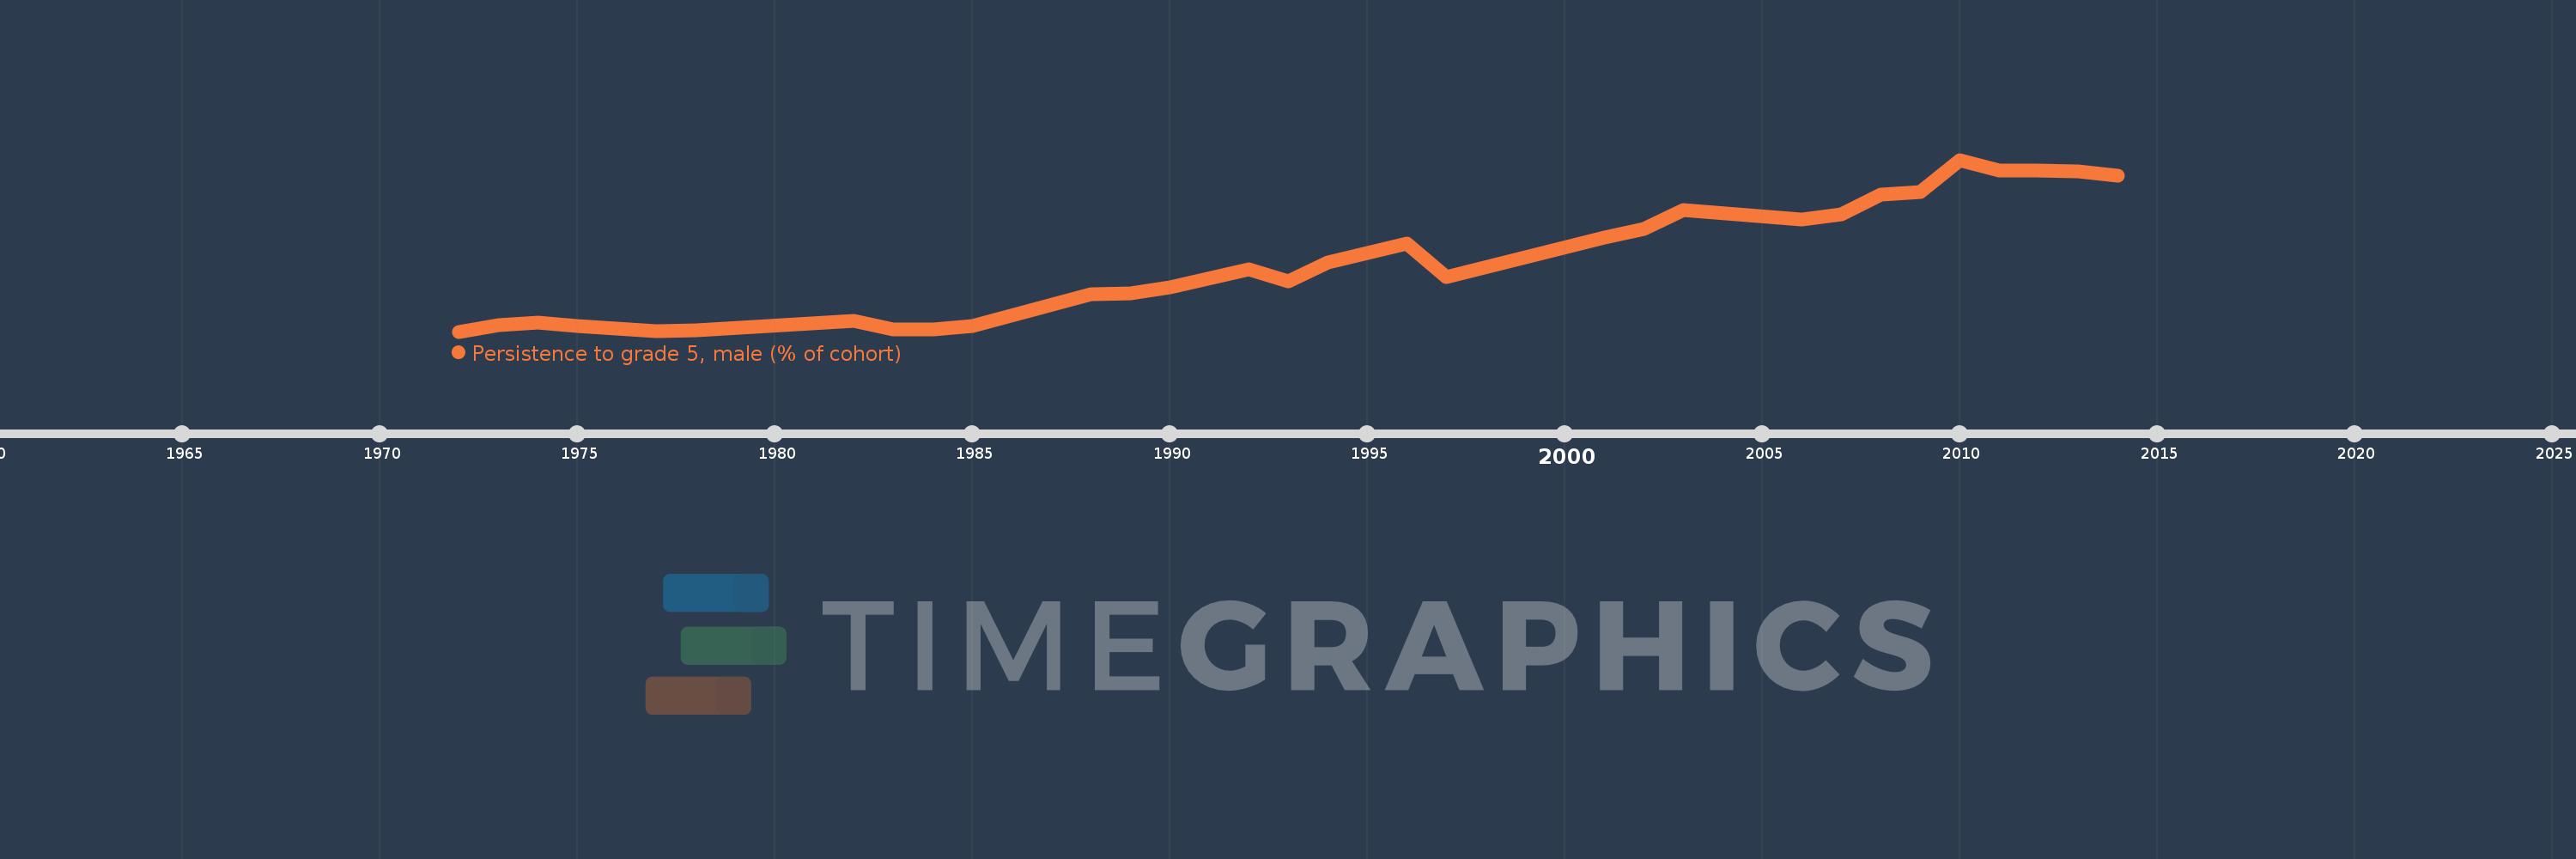
Persistence to grade 5, male (% of cohort)
2014,2013,2012,2011,2010,2009,2008,2007,2006,2003,2002,2001,1997,1996,1994,1993,1992,1990,1989,1988,1985,1984,1983,1982,1978,1977,1975,1974,1973,1972
This statistics in other country:
AfghanistanAlbaniaAlgeriaAndorraAngolaAntigua and BarbudaArab WorldArgentinaArubaBahamas, TheBahrainBangladeshBarbadosBelgiumBelizeBeninBermudaBhutanBoliviaBosnia and HerzegovinaBotswanaBrunei DarussalamBurkina FasoBurundiCabo VerdeCambodiaCameroonCanadaCaribbean small statesCayman IslandsCentral African RepublicChadChileChinaColombiaComorosCongo, Dem. Rep.Congo, Rep.Costa RicaCote d'IvoireCubaCyprusCzech RepublicDenmarkDjiboutiDominicaDominican RepublicEarly-demographic dividendEast Asia & PacificEast Asia & Pacific (excluding high income)East Asia & Pacific (IDA & IBRD countries)EcuadorEgypt, Arab Rep.El SalvadorEquatorial GuineaEritreaEstoniaEthiopiaFijiFinlandFranceGabonGambia, TheGeorgiaGhanaGreeceGrenadaGuatemalaGuineaGuinea-BissauGuyanaHaitiHeavily indebted poor countries (HIPC)HondurasHong Kong SAR, ChinaHungaryIcelandIDA blendIDA onlyIDA totalIndiaIndonesiaIran, Islamic Rep.IraqIrelandIsraelItalyJamaicaJapanJordanKenyaKiribatiKorea, Rep.KuwaitLao PDRLate-demographic dividendLatviaLeast developed countries: UN classificationLebanonLesothoLiberiaLibyaLiechtensteinLow incomeLower middle incomeLuxembourgMacao SAR, ChinaMadagascarMalawiMalaysiaMaldivesMaliMaltaMarshall IslandsMauritaniaMauritiusMexicoMiddle East & North AfricaMiddle East & North Africa (excluding high income)Middle East & North Africa (IDA & IBRD countries)MontenegroMoroccoMozambiqueMyanmarNamibiaNepalNetherlandsNicaraguaNigerNigeriaNorwayOmanOther small statesPacific island small statesPakistanPanamaPapua New GuineaParaguayPeruPhilippinesPolandPortugalPre-demographic dividendQatarRwandaSamoaSan MarinoSao Tome and PrincipeSaudi ArabiaSenegalSeychellesSierra LeoneSingaporeSloveniaSolomon IslandsSouth AfricaSouth AsiaSouth Asia (IDA & IBRD)SpainSri LankaSt. Kitts and NevisSt. LuciaSt. Vincent and the GrenadinesSub-Saharan Africa Sub-Saharan Africa (excluding high income)Sub-Saharan Africa (IDA & IBRD countries)SudanSurinameSwazilandSwedenSwitzerlandSyrian Arab RepublicTanzaniaThailandTimor-LesteTogoTongaTrinidad and TobagoTunisiaTurkeyUgandaUnited Arab EmiratesUpper middle incomeUruguayVanuatuVenezuela, RBVietnamYemen, Rep.ZambiaZimbabwe Timeline:
This timeline shows a graph from 1972 to 2014 of El Salvador. No data until 1971. Number of actual observations by date: 30.
Source name:
World Development Indicators
Source organization:
United Nations Educational, Scientific, and Cultural Organization (UNESCO) Institute for Statistics.
Categories, topics:
Education, Gender
Last updated:
apr 23, 2017
Indicators value changes by year
Maximum:
88.985
jan 1, 2010
At the date of observation
Value
Absolute change
Change from previous value
jan 1, 1972
34.83
+34.83
0.0%
jan 1, 1973
36.821
+1.991
5.72%
jan 1, 1974
37.773
+0.952
2.59%
jan 1, 1975
36.63
-1.143
-3.03%
jan 1, 1977
34.86
-1.771
-4.83%
jan 1, 1978
35.138
+0.278
0.8%
jan 1, 1982
38.294
+3.156
8.98%
jan 1, 1983
35.548
-2.746
-7.17%
jan 1, 1984
35.398
-0.15
-0.42%
jan 1, 1985
36.508
+1.111
3.14%
jan 1, 1988
46.666
+10.158
27.82%
jan 1, 1989
46.861
+0.195
0.42%
jan 1, 1990
48.841
+1.98
4.23%
jan 1, 1992
54.479
+5.638
11.54%
jan 1, 1993
50.753
-3.727
-6.84%
jan 1, 1994
56.586
+5.833
11.49%
jan 1, 1996
62.564
+5.978
10.57%
jan 1, 1997
51.894
-10.671
-17.06%
jan 1, 2001
64.403
+12.509
24.11%
jan 1, 2002
67.1
+2.696
4.19%
jan 1, 2003
73.01
+5.911
8.81%
jan 1, 2006
70.061
-2.949
-4.04%
jan 1, 2007
71.837
+1.776
2.54%
jan 1, 2008
78.123
+6.286
8.75%
jan 1, 2009
78.879
+0.756
0.97%
jan 1, 2010
88.985
+10.107
12.81%
jan 1, 2011
85.696
-3.29
-3.7%
jan 1, 2012
85.546
-0.15
-0.17%
jan 1, 2013
85.395
-0.151
-0.18%
jan 1, 2014
84.057
-1.338
-1.57%
Ranking of countries by current statistics by years


Comments: