29
/
en
AIzaSyAYiBZKx7MnpbEhh9jyipgxe19OcubqV5w
April 1, 2024
283743
West Bank and Gaza
PSE
true
2
1
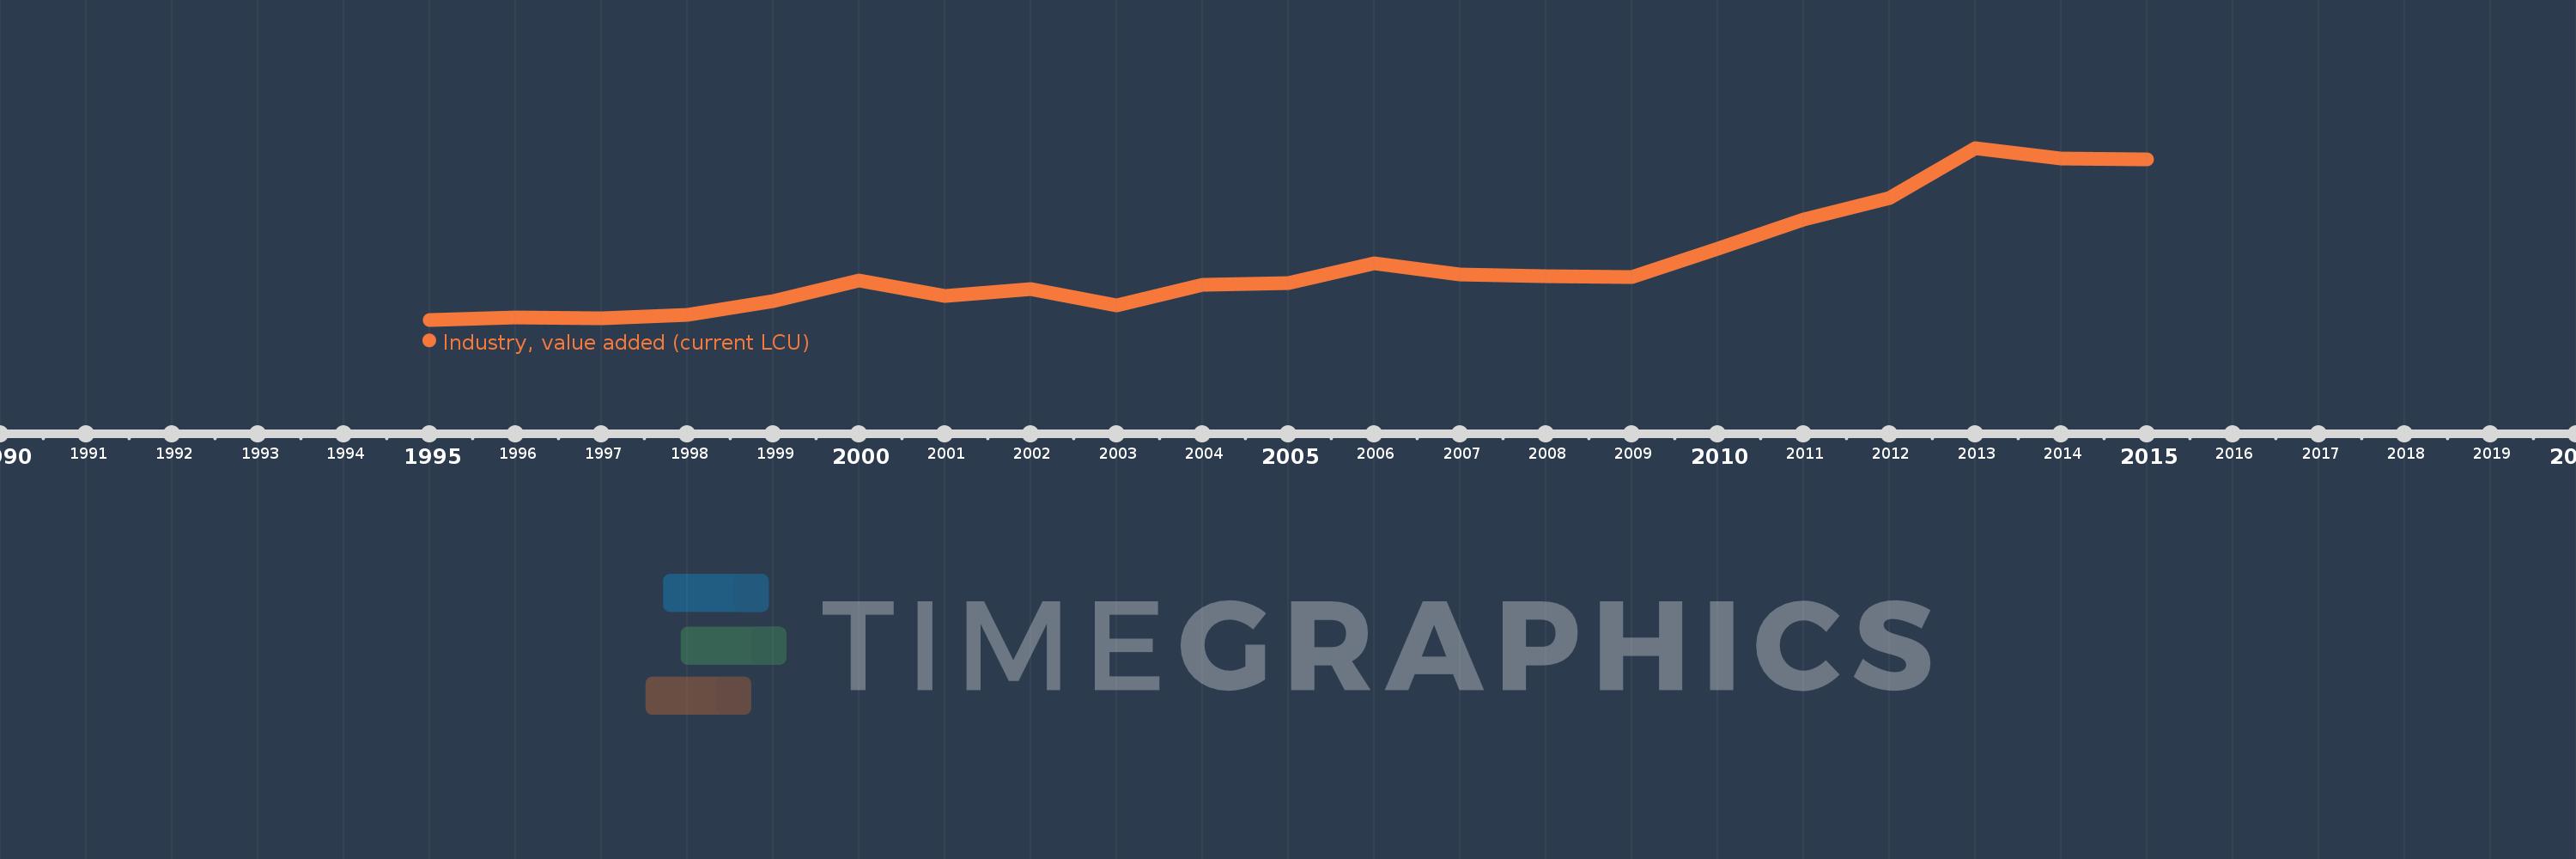
Industry, value added (current LCU)
2015,2014,2013,2012,2011,2010,2009,2008,2007,2006,2005,2004,2003,2002,2001,2000,1999,1998,1997,1996,1995
This statistics in other country:
AfghanistanAlbaniaAlgeriaAndorraAngolaAntigua and BarbudaArgentinaArmeniaArubaAustraliaAustriaAzerbaijanBahamas, TheBahrainBangladeshBarbadosBelarusBelgiumBelizeBeninBermudaBhutanBoliviaBosnia and HerzegovinaBotswanaBrazilBrunei DarussalamBulgariaBurkina FasoBurundiCabo VerdeCambodiaCameroonCanadaCayman IslandsCentral African RepublicChadChileChinaColombiaComorosCongo, Dem. Rep.Congo, Rep.Costa RicaCote d'IvoireCroatiaCubaCyprusCzech RepublicDenmarkDjiboutiDominicaDominican RepublicEcuadorEgypt, Arab Rep.El SalvadorEquatorial GuineaEritreaEstoniaEthiopiaFijiFinlandFranceGabonGambia, TheGeorgiaGermanyGhanaGreeceGrenadaGuatemalaGuineaGuinea-BissauGuyanaHondurasHong Kong SAR, ChinaHungaryIcelandIndiaIndonesiaIran, Islamic Rep.IraqIrelandItalyJamaicaJapanJordanKazakhstanKenyaKiribatiKorea, Rep.KosovoKuwaitKyrgyz RepublicLao PDRLatviaLebanonLesothoLiberiaLibyaLiechtensteinLithuaniaLuxembourgMacao SAR, ChinaMacedonia, FYRMadagascarMalawiMalaysiaMaldivesMaliMaltaMarshall IslandsMauritaniaMauritiusMexicoMicronesia, Fed. Sts.MoldovaMongoliaMontenegroMoroccoMozambiqueMyanmarNamibiaNepalNetherlandsNew CaledoniaNew ZealandNicaraguaNigerNigeriaNorwayOmanPakistanPalauPanamaPapua New GuineaParaguayPeruPhilippinesPolandPortugalPuerto RicoQatarRomaniaRussian FederationRwandaSamoaSao Tome and PrincipeSaudi ArabiaSenegalSerbiaSeychellesSierra LeoneSingaporeSlovak RepublicSloveniaSolomon IslandsSomaliaSouth AfricaSpainSri LankaSt. Kitts and NevisSt. LuciaSt. Vincent and the GrenadinesSudanSurinameSwazilandSwedenSwitzerlandSyrian Arab RepublicTajikistanTanzaniaThailandTimor-LesteTogoTongaTrinidad and TobagoTunisiaTurkeyTurkmenistanTuvaluUgandaUkraineUnited Arab EmiratesUnited KingdomUnited StatesUruguayUzbekistanVanuatuVenezuela, RBVietnamWest Bank and GazaYemen, Rep.ZambiaZimbabwe Timeline:
This timeline shows a graph from 1995 to 2015 of West Bank and Gaza. No data until 1994. Number of actual observations by date: 21.
Source name:
World Development Indicators
Source organization:
World Bank national accounts data, and OECD National Accounts data files.
Categories, topics:
Economy & Growth
Last updated:
apr 23, 2017
Indicators value changes by year
Minimum:
2.838 bln
jan 1, 1995
Maximum:
9.526 bln
jan 1, 2013
At the date of observation
Value
Absolute change
Change from previous value
jan 1, 1995
2.838 bln
+2.838 bln
0.0%
jan 1, 1996
2.919 bln
+80.59 mln
2.84%
jan 1, 1997
2.894 bln
-24.957 mln
-0.86%
jan 1, 1998
3.013 bln
+119.373 mln
4.13%
jan 1, 1999
3.552 bln
+539.365 mln
17.9%
jan 1, 2000
4.375 bln
+822.915 mln
23.17%
jan 1, 2001
3.78 bln
-595.184 mln
-13.6%
jan 1, 2002
4.045 bln
+264.978 mln
7.01%
jan 1, 2003
3.381 bln
-664.148 mln
-16.42%
jan 1, 2004
4.187 bln
+806.016 mln
23.84%
jan 1, 2005
4.271 bln
+83.988 mln
2.01%
jan 1, 2006
5.032 bln
+760.711 mln
17.81%
jan 1, 2007
4.61 bln
-422.084 mln
-8.39%
jan 1, 2008
4.534 bln
-75.415 mln
-1.64%
jan 1, 2009
4.487 bln
-47.16 mln
-1.04%
jan 1, 2010
5.595 bln
+1.108 bln
24.69%
jan 1, 2011
6.726 bln
+1.131 bln
20.22%
jan 1, 2012
7.578 bln
+852.122 mln
12.67%
jan 1, 2013
9.526 bln
+1.948 bln
25.71%
jan 1, 2014
9.112 bln
-414.172 mln
-4.35%
jan 1, 2015
9.087 bln
-25.422 mln
-0.28%
Ranking of countries by current statistics by years


Comments: