29
/
en
AIzaSyAYiBZKx7MnpbEhh9jyipgxe19OcubqV5w
April 1, 2024
114947
Croatia
HRV
true
2
1
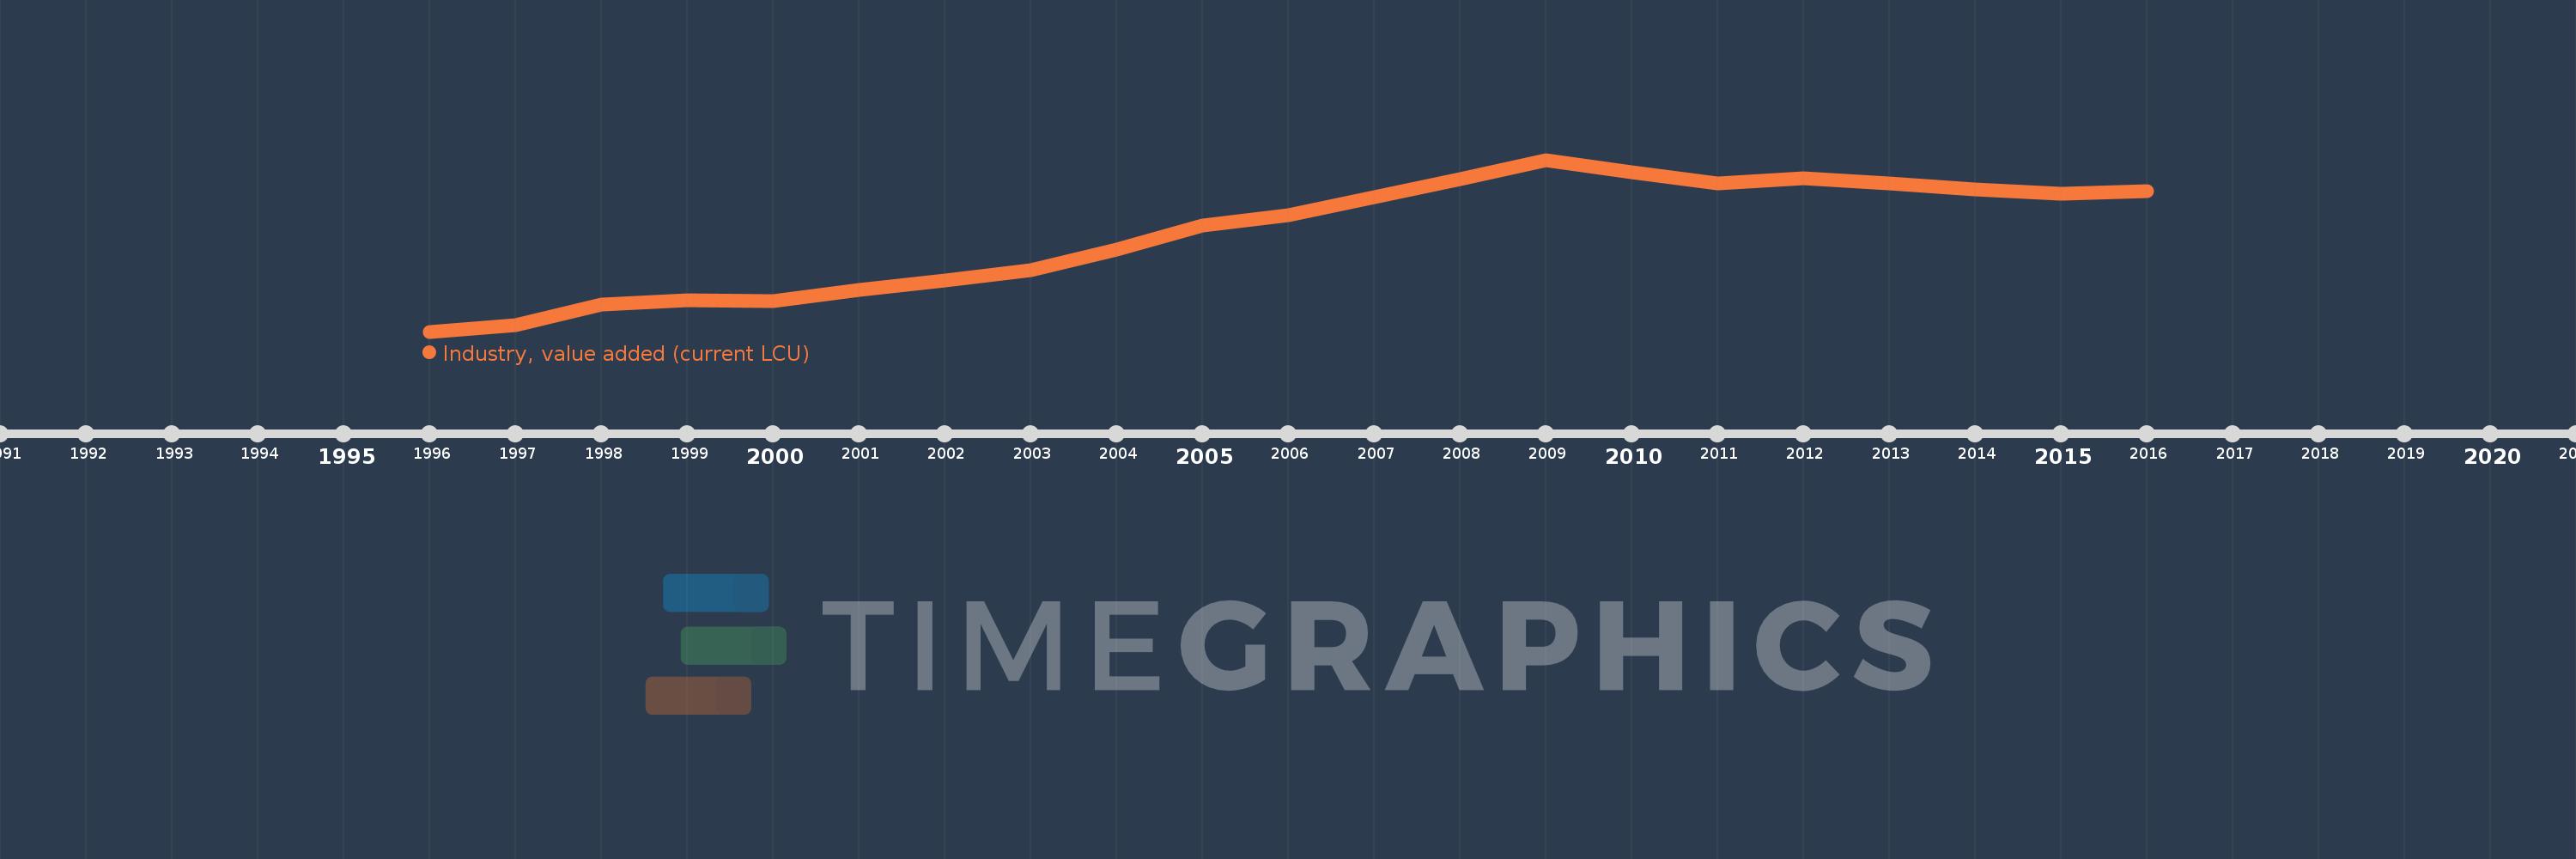
Industry, value added (current LCU)
2016,2015,2014,2013,2012,2011,2010,2009,2008,2007,2006,2005,2004,2003,2002,2001,2000,1999,1998,1997,1996
This statistics in other country:
AfghanistanAlbaniaAlgeriaAndorraAngolaAntigua and BarbudaArgentinaArmeniaArubaAustraliaAustriaAzerbaijanBahamas, TheBahrainBangladeshBarbadosBelarusBelgiumBelizeBeninBermudaBhutanBoliviaBosnia and HerzegovinaBotswanaBrazilBrunei DarussalamBulgariaBurkina FasoBurundiCabo VerdeCambodiaCameroonCanadaCayman IslandsCentral African RepublicChadChileChinaColombiaComorosCongo, Dem. Rep.Congo, Rep.Costa RicaCote d'IvoireCroatiaCubaCyprusCzech RepublicDenmarkDjiboutiDominicaDominican RepublicEcuadorEgypt, Arab Rep.El SalvadorEquatorial GuineaEritreaEstoniaEthiopiaFijiFinlandFranceGabonGambia, TheGeorgiaGermanyGhanaGreeceGrenadaGuatemalaGuineaGuinea-BissauGuyanaHondurasHong Kong SAR, ChinaHungaryIcelandIndiaIndonesiaIran, Islamic Rep.IraqIrelandItalyJamaicaJapanJordanKazakhstanKenyaKiribatiKorea, Rep.KosovoKuwaitKyrgyz RepublicLao PDRLatviaLebanonLesothoLiberiaLibyaLiechtensteinLithuaniaLuxembourgMacao SAR, ChinaMacedonia, FYRMadagascarMalawiMalaysiaMaldivesMaliMaltaMarshall IslandsMauritaniaMauritiusMexicoMicronesia, Fed. Sts.MoldovaMongoliaMontenegroMoroccoMozambiqueMyanmarNamibiaNepalNetherlandsNew CaledoniaNew ZealandNicaraguaNigerNigeriaNorwayOmanPakistanPalauPanamaPapua New GuineaParaguayPeruPhilippinesPolandPortugalPuerto RicoQatarRomaniaRussian FederationRwandaSamoaSao Tome and PrincipeSaudi ArabiaSenegalSerbiaSeychellesSierra LeoneSingaporeSlovak RepublicSloveniaSolomon IslandsSomaliaSouth AfricaSpainSri LankaSt. Kitts and NevisSt. LuciaSt. Vincent and the GrenadinesSudanSurinameSwazilandSwedenSwitzerlandSyrian Arab RepublicTajikistanTanzaniaThailandTimor-LesteTogoTongaTrinidad and TobagoTunisiaTurkeyTurkmenistanTuvaluUgandaUkraineUnited Arab EmiratesUnited KingdomUnited StatesUruguayUzbekistanVanuatuVenezuela, RBVietnamWest Bank and GazaYemen, Rep.ZambiaZimbabwe Timeline:
This timeline shows a graph from 1996 to 2016 of Croatia. No data until 1995. Number of actual observations by date: 21.
Source name:
World Development Indicators
Source organization:
World Bank national accounts data, and OECD National Accounts data files.
Categories, topics:
Economy & Growth
Last updated:
apr 23, 2017
Indicators value changes by year
Minimum:
31.534 bln
jan 1, 1996
Maximum:
82.828 bln
jan 1, 2009
At the date of observation
Value
Absolute change
Change from previous value
jan 1, 1996
31.534 bln
+31.534 bln
0.0%
jan 1, 1997
33.534 bln
+2.0 bln
6.34%
jan 1, 1998
39.532 bln
+5.997 bln
17.88%
jan 1, 1999
40.995 bln
+1.463 bln
3.7%
jan 1, 2000
40.64 bln
-354.923 mln
-0.87%
jan 1, 2001
44.012 bln
+3.372 bln
8.3%
jan 1, 2002
46.68 bln
+2.668 bln
6.06%
jan 1, 2003
49.851 bln
+3.171 bln
6.79%
jan 1, 2004
56.14 bln
+6.289 bln
12.62%
jan 1, 2005
63.33 bln
+7.19 bln
12.81%
jan 1, 2006
66.408 bln
+3.078 bln
4.86%
jan 1, 2007
71.584 bln
+5.176 bln
7.79%
jan 1, 2008
77.049 bln
+5.465 bln
7.63%
jan 1, 2009
82.828 bln
+5.779 bln
7.5%
jan 1, 2010
79.054 bln
-3.774 bln
-4.56%
jan 1, 2011
75.898 bln
-3.156 bln
-3.99%
jan 1, 2012
77.205 bln
+1.307 bln
1.72%
jan 1, 2013
75.887 bln
-1.317 bln
-1.71%
jan 1, 2014
73.93 bln
-1.958 bln
-2.58%
jan 1, 2015
72.686 bln
-1.244 bln
-1.68%
jan 1, 2016
73.37 bln
+684.021 mln
0.94%
Ranking of countries by current statistics by years


Comments: