29
/
en
AIzaSyAYiBZKx7MnpbEhh9jyipgxe19OcubqV5w
April 1, 2024
266985
Trinidad and Tobago
TTO
true
2
1
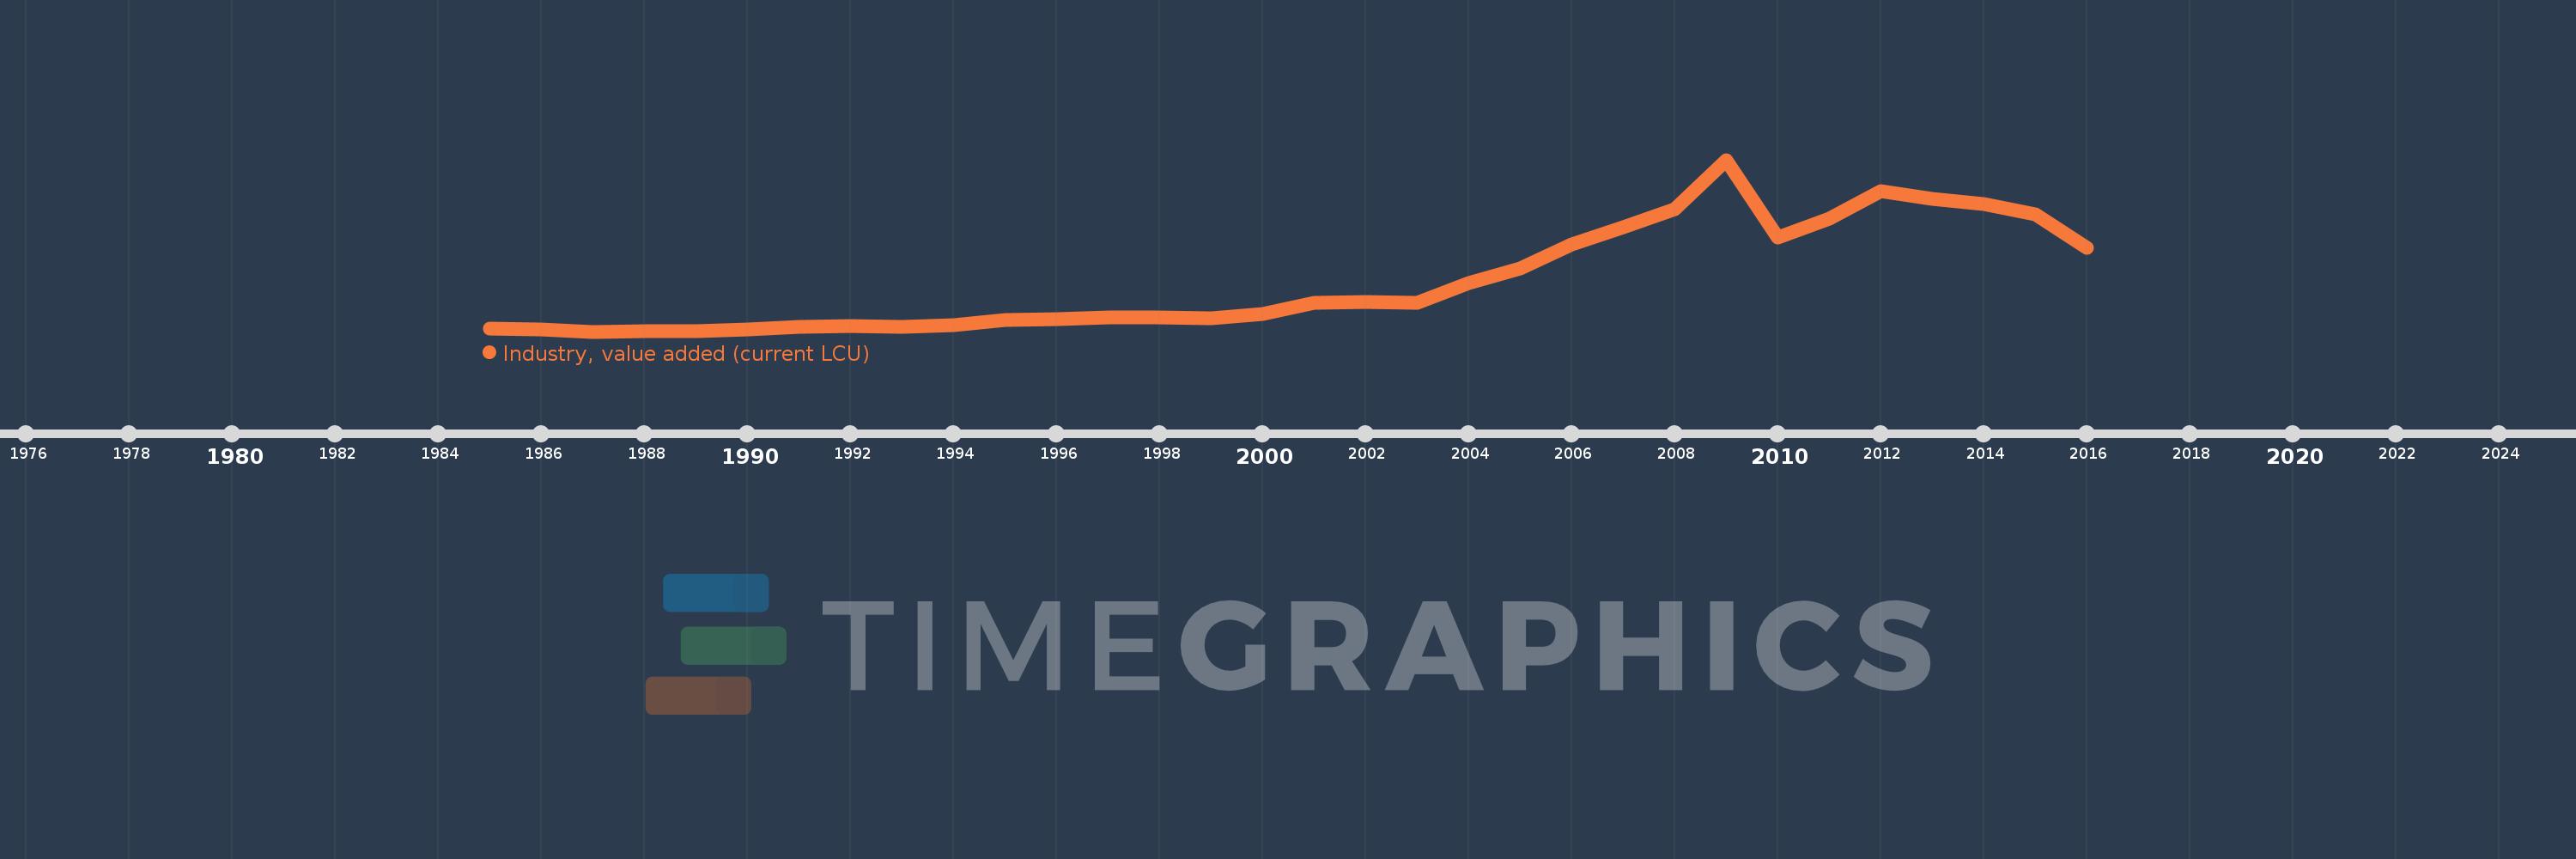
Industry, value added (current LCU)
2016,2015,2014,2013,2012,2011,2010,2009,2008,2007,2006,2005,2004,2003,2002,2001,2000,1999,1998,1997,1996,1995,1994,1993,1992,1991,1990,1989,1988,1987,1986,1985
This statistics in other country:
AfghanistanAlbaniaAlgeriaAndorraAngolaAntigua and BarbudaArgentinaArmeniaArubaAustraliaAustriaAzerbaijanBahamas, TheBahrainBangladeshBarbadosBelarusBelgiumBelizeBeninBermudaBhutanBoliviaBosnia and HerzegovinaBotswanaBrazilBrunei DarussalamBulgariaBurkina FasoBurundiCabo VerdeCambodiaCameroonCanadaCayman IslandsCentral African RepublicChadChileChinaColombiaComorosCongo, Dem. Rep.Congo, Rep.Costa RicaCote d'IvoireCroatiaCubaCyprusCzech RepublicDenmarkDjiboutiDominicaDominican RepublicEcuadorEgypt, Arab Rep.El SalvadorEquatorial GuineaEritreaEstoniaEthiopiaFijiFinlandFranceGabonGambia, TheGeorgiaGermanyGhanaGreeceGrenadaGuatemalaGuineaGuinea-BissauGuyanaHondurasHong Kong SAR, ChinaHungaryIcelandIndiaIndonesiaIran, Islamic Rep.IraqIrelandItalyJamaicaJapanJordanKazakhstanKenyaKiribatiKorea, Rep.KosovoKuwaitKyrgyz RepublicLao PDRLatviaLebanonLesothoLiberiaLibyaLiechtensteinLithuaniaLuxembourgMacao SAR, ChinaMacedonia, FYRMadagascarMalawiMalaysiaMaldivesMaliMaltaMarshall IslandsMauritaniaMauritiusMexicoMicronesia, Fed. Sts.MoldovaMongoliaMontenegroMoroccoMozambiqueMyanmarNamibiaNepalNetherlandsNew CaledoniaNew ZealandNicaraguaNigerNigeriaNorwayOmanPakistanPalauPanamaPapua New GuineaParaguayPeruPhilippinesPolandPortugalPuerto RicoQatarRomaniaRussian FederationRwandaSamoaSao Tome and PrincipeSaudi ArabiaSenegalSerbiaSeychellesSierra LeoneSingaporeSlovak RepublicSloveniaSolomon IslandsSomaliaSouth AfricaSpainSri LankaSt. Kitts and NevisSt. LuciaSt. Vincent and the GrenadinesSudanSurinameSwazilandSwedenSwitzerlandSyrian Arab RepublicTajikistanTanzaniaThailandTimor-LesteTogoTongaTrinidad and TobagoTunisiaTurkeyTurkmenistanTuvaluUgandaUkraineUnited Arab EmiratesUnited KingdomUnited StatesUruguayUzbekistanVanuatuVenezuela, RBVietnamWest Bank and GazaYemen, Rep.ZambiaZimbabwe Timeline:
This timeline shows a graph from 1985 to 2016 of Trinidad and Tobago. No data until 1984. Number of actual observations by date: 32.
Source name:
World Development Indicators
Source organization:
World Bank national accounts data, and OECD National Accounts data files.
Categories, topics:
Economy & Growth
Last updated:
apr 23, 2017
Indicators value changes by year
Minimum:
6.748 bln
jan 1, 1987
Maximum:
112.146 bln
jan 1, 2009
At the date of observation
Value
Absolute change
Change from previous value
jan 1, 1985
8.437 bln
+8.437 bln
0.0%
jan 1, 1986
7.931 bln
-506.2 mln
-6.0%
jan 1, 1987
6.748 bln
-1.183 bln
-14.92%
jan 1, 1988
7.126 bln
+378.3 mln
5.61%
jan 1, 1989
6.975 bln
-151.0 mln
-2.12%
jan 1, 1990
8.017 bln
+1.042 bln
14.94%
jan 1, 1991
9.725 bln
+1.708 bln
21.3%
jan 1, 1992
10.099 bln
+373.9 mln
3.84%
jan 1, 1993
9.871 bln
-228.0 mln
-2.26%
jan 1, 1994
10.463 bln
+592.0 mln
6.0%
jan 1, 1995
13.661 bln
+3.198 bln
30.56%
jan 1, 1996
14.25 bln
+589.199 mln
4.31%
jan 1, 1997
15.614 bln
+1.364 bln
9.57%
jan 1, 1998
15.333 bln
-280.8 mln
-1.8%
jan 1, 1999
14.658 bln
-675.0 mln
-4.4%
jan 1, 2000
17.424 bln
+2.766 bln
18.87%
jan 1, 2001
24.419 bln
+6.995 bln
40.15%
jan 1, 2002
24.867 bln
+447.601 mln
1.83%
jan 1, 2003
24.154 bln
-713.301 mln
-2.87%
jan 1, 2004
36.65 bln
+12.496 bln
51.73%
jan 1, 2005
45.48 bln
+8.831 bln
24.1%
jan 1, 2006
60.054 bln
+14.573 bln
32.04%
jan 1, 2007
70.521 bln
+10.467 bln
17.43%
jan 1, 2008
81.695 bln
+11.174 bln
15.85%
jan 1, 2009
112.146 bln
+30.451 bln
37.27%
jan 1, 2010
64.444 bln
-47.702 bln
-42.54%
jan 1, 2011
76.022 bln
+11.578 bln
17.97%
jan 1, 2012
92.998 bln
+16.976 bln
22.33%
jan 1, 2013
88.127 bln
-4.87 bln
-5.24%
jan 1, 2014
84.831 bln
-3.296 bln
-3.74%
jan 1, 2015
78.701 bln
-6.131 bln
-7.23%
jan 1, 2016
58.052 bln
-20.649 bln
-26.24%
Ranking of countries by current statistics by years


Comments: