29
/
en
AIzaSyAYiBZKx7MnpbEhh9jyipgxe19OcubqV5w
April 1, 2024
242738
Slovenia
SVN
true
2
1
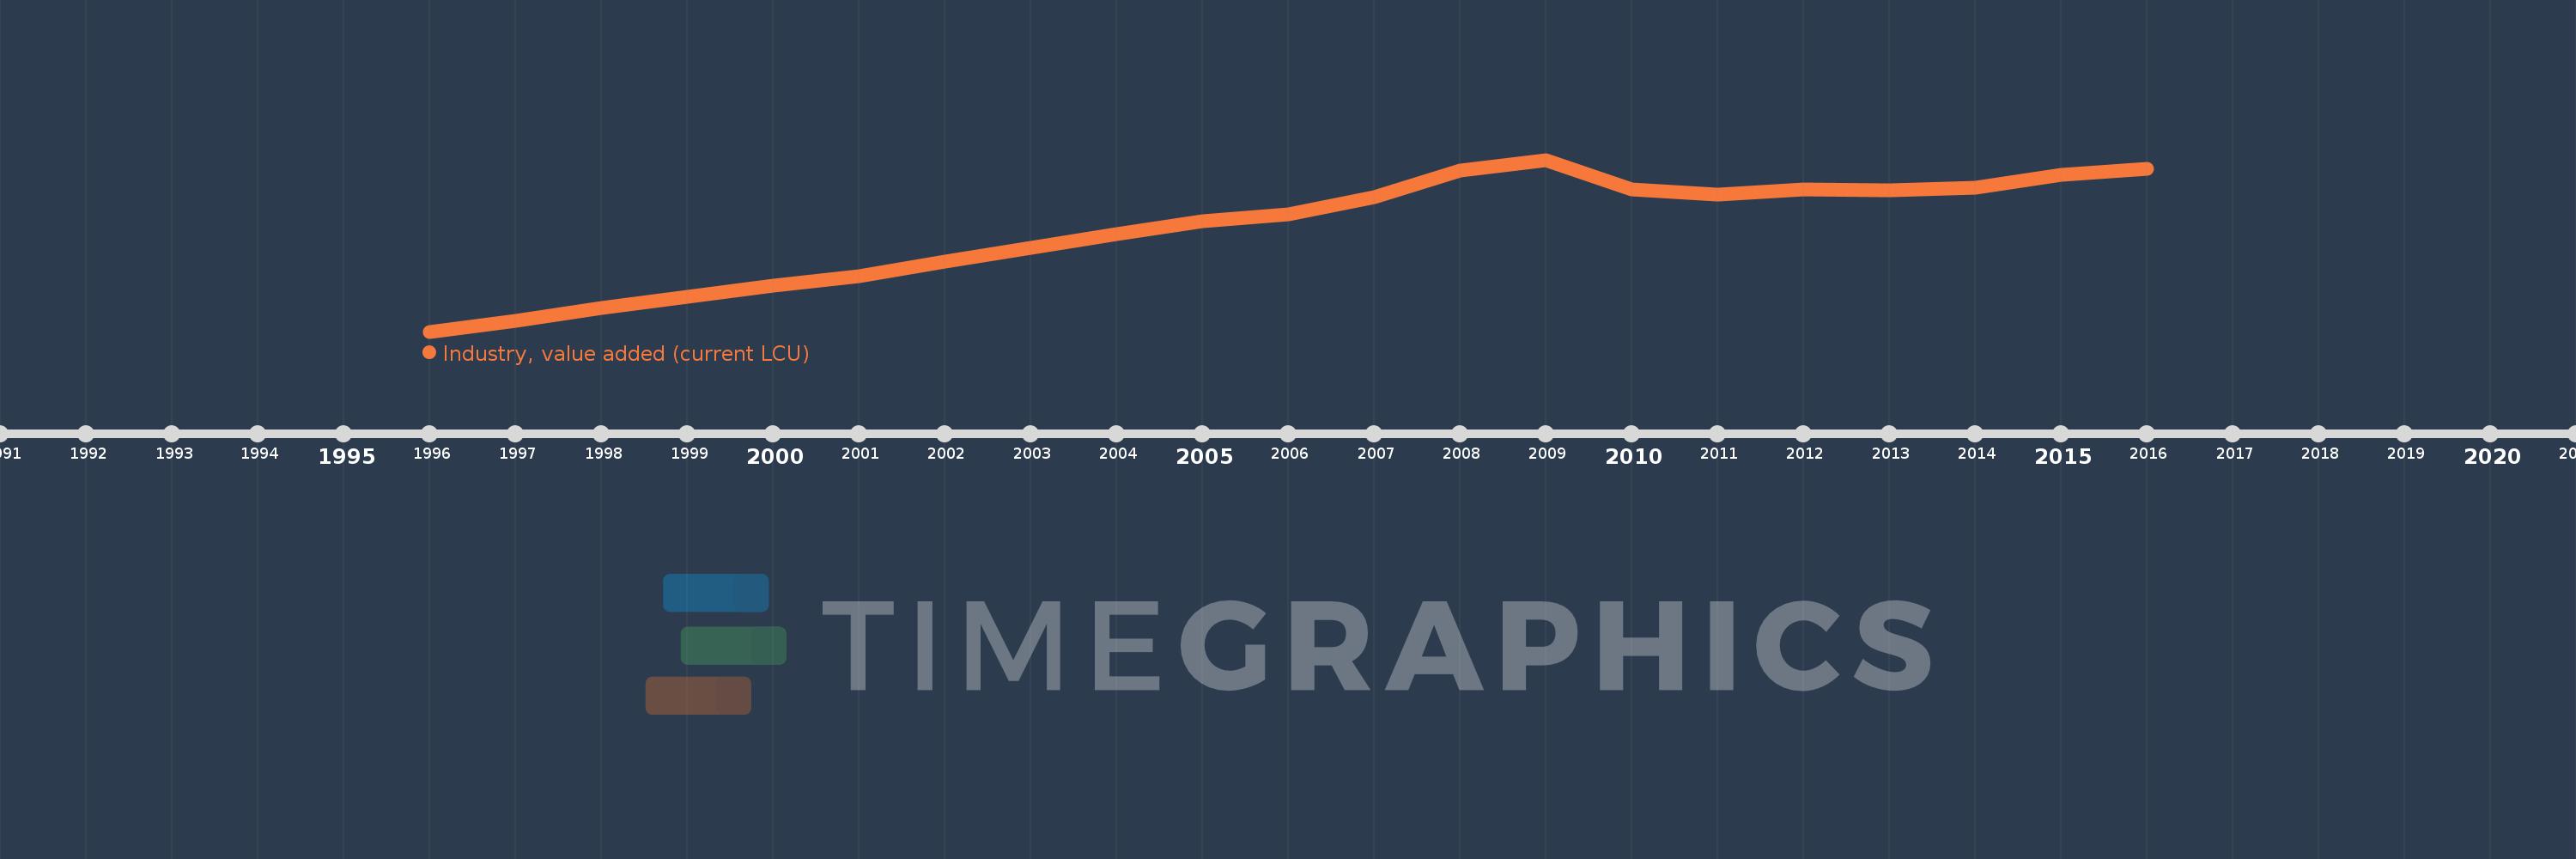
Industry, value added (current LCU)
2016,2015,2014,2013,2012,2011,2010,2009,2008,2007,2006,2005,2004,2003,2002,2001,2000,1999,1998,1997,1996
This statistics in other country:
AfghanistanAlbaniaAlgeriaAndorraAngolaAntigua and BarbudaArgentinaArmeniaArubaAustraliaAustriaAzerbaijanBahamas, TheBahrainBangladeshBarbadosBelarusBelgiumBelizeBeninBermudaBhutanBoliviaBosnia and HerzegovinaBotswanaBrazilBrunei DarussalamBulgariaBurkina FasoBurundiCabo VerdeCambodiaCameroonCanadaCayman IslandsCentral African RepublicChadChileChinaColombiaComorosCongo, Dem. Rep.Congo, Rep.Costa RicaCote d'IvoireCroatiaCubaCyprusCzech RepublicDenmarkDjiboutiDominicaDominican RepublicEcuadorEgypt, Arab Rep.El SalvadorEquatorial GuineaEritreaEstoniaEthiopiaFijiFinlandFranceGabonGambia, TheGeorgiaGermanyGhanaGreeceGrenadaGuatemalaGuineaGuinea-BissauGuyanaHondurasHong Kong SAR, ChinaHungaryIcelandIndiaIndonesiaIran, Islamic Rep.IraqIrelandItalyJamaicaJapanJordanKazakhstanKenyaKiribatiKorea, Rep.KosovoKuwaitKyrgyz RepublicLao PDRLatviaLebanonLesothoLiberiaLibyaLiechtensteinLithuaniaLuxembourgMacao SAR, ChinaMacedonia, FYRMadagascarMalawiMalaysiaMaldivesMaliMaltaMarshall IslandsMauritaniaMauritiusMexicoMicronesia, Fed. Sts.MoldovaMongoliaMontenegroMoroccoMozambiqueMyanmarNamibiaNepalNetherlandsNew CaledoniaNew ZealandNicaraguaNigerNigeriaNorwayOmanPakistanPalauPanamaPapua New GuineaParaguayPeruPhilippinesPolandPortugalPuerto RicoQatarRomaniaRussian FederationRwandaSamoaSao Tome and PrincipeSaudi ArabiaSenegalSerbiaSeychellesSierra LeoneSingaporeSlovak RepublicSloveniaSolomon IslandsSomaliaSouth AfricaSpainSri LankaSt. Kitts and NevisSt. LuciaSt. Vincent and the GrenadinesSudanSurinameSwazilandSwedenSwitzerlandSyrian Arab RepublicTajikistanTanzaniaThailandTimor-LesteTogoTongaTrinidad and TobagoTunisiaTurkeyTurkmenistanTuvaluUgandaUkraineUnited Arab EmiratesUnited KingdomUnited StatesUruguayUzbekistanVanuatuVenezuela, RBVietnamWest Bank and GazaYemen, Rep.ZambiaZimbabwe Timeline:
This timeline shows a graph from 1996 to 2016 of Slovenia. No data until 1995. Number of actual observations by date: 21.
Source name:
World Development Indicators
Source organization:
World Bank national accounts data, and OECD National Accounts data files.
Categories, topics:
Economy & Growth
Last updated:
apr 23, 2017
Indicators value changes by year
Minimum:
3.133 bln
jan 1, 1996
Maximum:
11.347 bln
jan 1, 2009
At the date of observation
Value
Absolute change
Change from previous value
jan 1, 1996
3.133 bln
+3.133 bln
0.0%
jan 1, 1997
3.662 bln
+529.164 mln
16.89%
jan 1, 1998
4.277 bln
+614.355 mln
16.77%
jan 1, 1999
4.797 bln
+520.063 mln
12.16%
jan 1, 2000
5.347 bln
+549.842 mln
11.46%
jan 1, 2001
5.781 bln
+434.267 mln
8.12%
jan 1, 2002
6.472 bln
+690.912 mln
11.95%
jan 1, 2003
7.117 bln
+644.974 mln
9.97%
jan 1, 2004
7.797 bln
+679.959 mln
9.55%
jan 1, 2005
8.41 bln
+613.652 mln
7.87%
jan 1, 2006
8.753 bln
+342.365 mln
4.07%
jan 1, 2007
9.568 bln
+815.203 mln
9.31%
jan 1, 2008
10.83 bln
+1.262 bln
13.19%
jan 1, 2009
11.347 bln
+516.707 mln
4.77%
jan 1, 2010
9.931 bln
-1.416 bln
-12.48%
jan 1, 2011
9.666 bln
-264.958 mln
-2.67%
jan 1, 2012
9.927 bln
+260.872 mln
2.7%
jan 1, 2013
9.903 bln
-24.145 mln
-0.24%
jan 1, 2014
10.002 bln
+99.499 mln
1.0%
jan 1, 2015
10.647 bln
+644.995 mln
6.45%
jan 1, 2016
10.908 bln
+260.922 mln
2.45%
Ranking of countries by current statistics by years


Comments: