29
/
en
AIzaSyAYiBZKx7MnpbEhh9jyipgxe19OcubqV5w
April 1, 2024
166299
Kazakhstan
KAZ
true
2
1
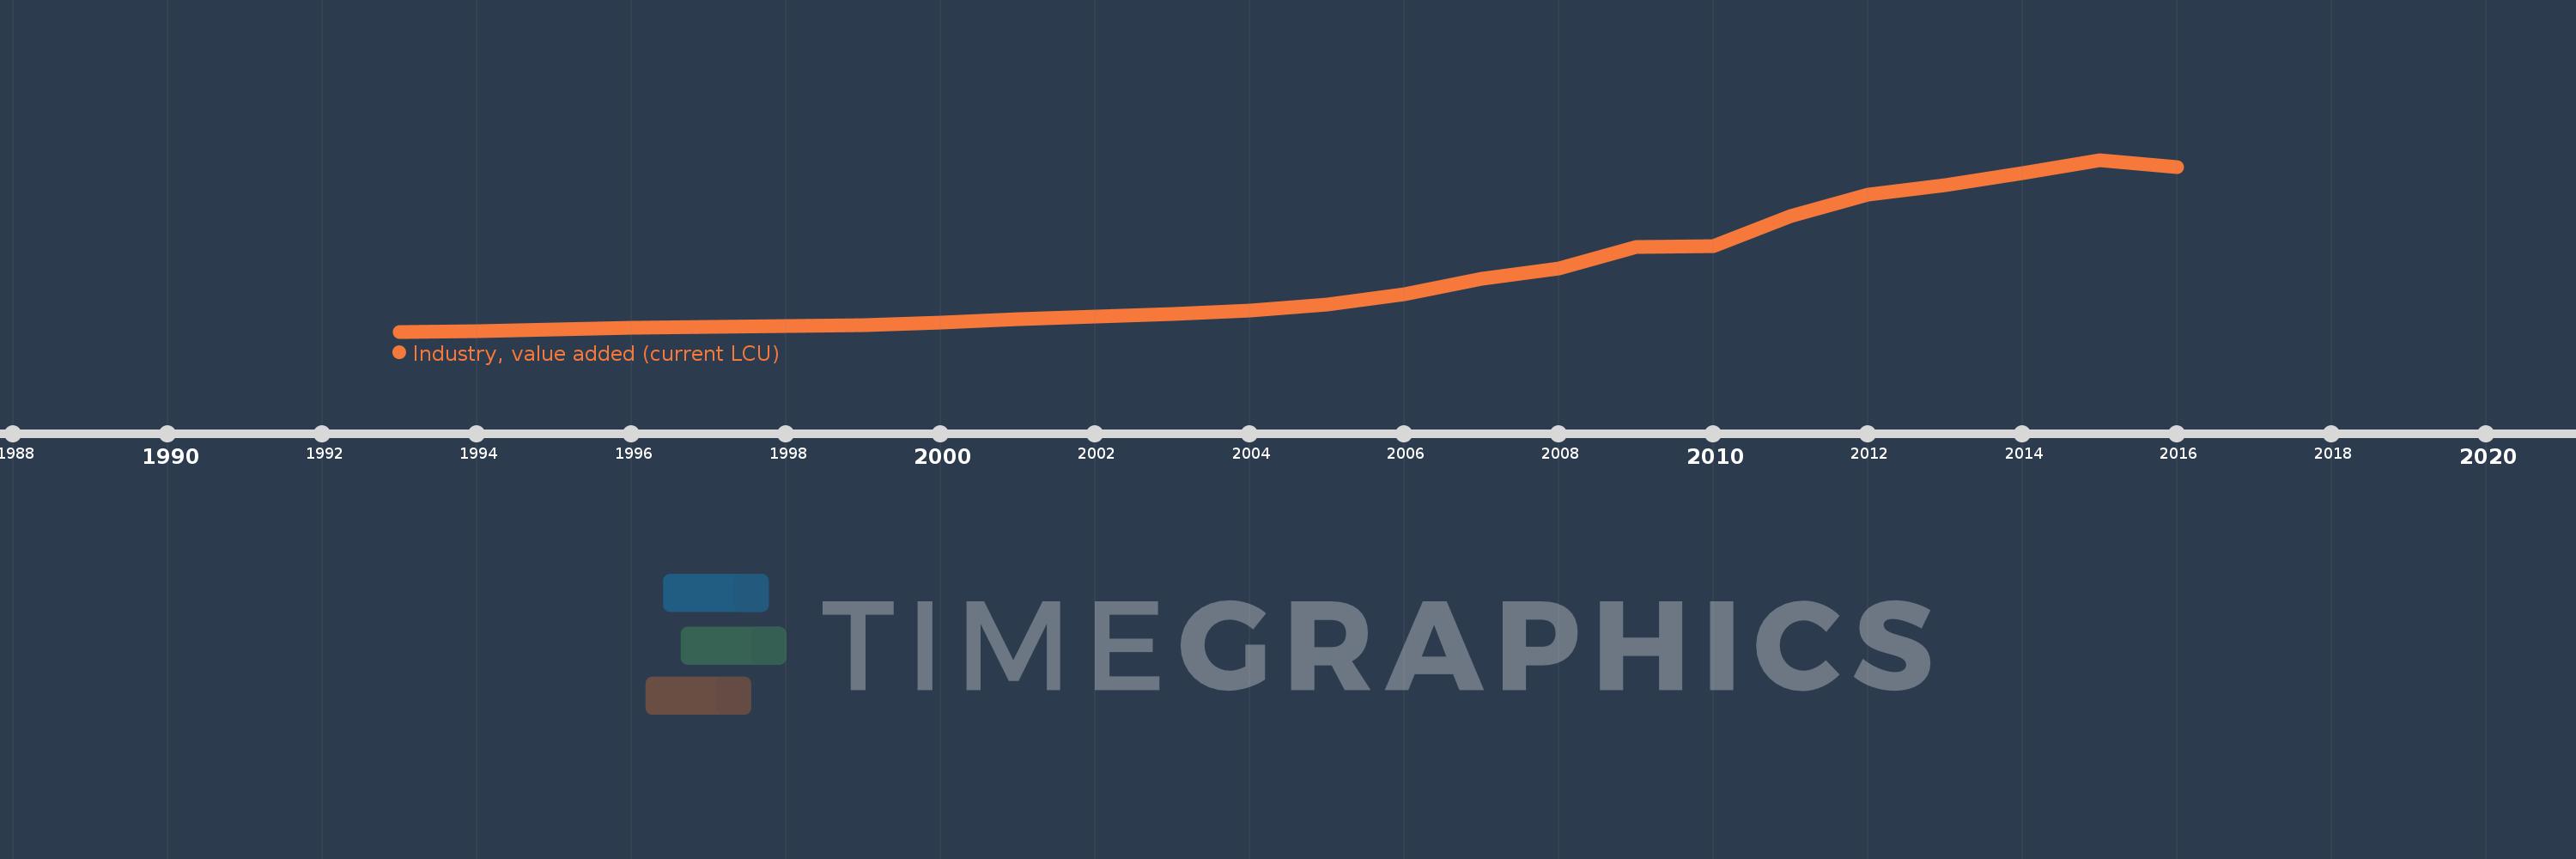
Industry, value added (current LCU)
2016,2015,2014,2013,2012,2011,2010,2009,2008,2007,2006,2005,2004,2003,2002,2001,2000,1999,1998,1997,1996,1995,1994,1993
This statistics in other country:
AfghanistanAlbaniaAlgeriaAndorraAngolaAntigua and BarbudaArgentinaArmeniaArubaAustraliaAustriaAzerbaijanBahamas, TheBahrainBangladeshBarbadosBelarusBelgiumBelizeBeninBermudaBhutanBoliviaBosnia and HerzegovinaBotswanaBrazilBrunei DarussalamBulgariaBurkina FasoBurundiCabo VerdeCambodiaCameroonCanadaCayman IslandsCentral African RepublicChadChileChinaColombiaComorosCongo, Dem. Rep.Congo, Rep.Costa RicaCote d'IvoireCroatiaCubaCyprusCzech RepublicDenmarkDjiboutiDominicaDominican RepublicEcuadorEgypt, Arab Rep.El SalvadorEquatorial GuineaEritreaEstoniaEthiopiaFijiFinlandFranceGabonGambia, TheGeorgiaGermanyGhanaGreeceGrenadaGuatemalaGuineaGuinea-BissauGuyanaHondurasHong Kong SAR, ChinaHungaryIcelandIndiaIndonesiaIran, Islamic Rep.IraqIrelandItalyJamaicaJapanJordanKazakhstanKenyaKiribatiKorea, Rep.KosovoKuwaitKyrgyz RepublicLao PDRLatviaLebanonLesothoLiberiaLibyaLiechtensteinLithuaniaLuxembourgMacao SAR, ChinaMacedonia, FYRMadagascarMalawiMalaysiaMaldivesMaliMaltaMarshall IslandsMauritaniaMauritiusMexicoMicronesia, Fed. Sts.MoldovaMongoliaMontenegroMoroccoMozambiqueMyanmarNamibiaNepalNetherlandsNew CaledoniaNew ZealandNicaraguaNigerNigeriaNorwayOmanPakistanPalauPanamaPapua New GuineaParaguayPeruPhilippinesPolandPortugalPuerto RicoQatarRomaniaRussian FederationRwandaSamoaSao Tome and PrincipeSaudi ArabiaSenegalSerbiaSeychellesSierra LeoneSingaporeSlovak RepublicSloveniaSolomon IslandsSomaliaSouth AfricaSpainSri LankaSt. Kitts and NevisSt. LuciaSt. Vincent and the GrenadinesSudanSurinameSwazilandSwedenSwitzerlandSyrian Arab RepublicTajikistanTanzaniaThailandTimor-LesteTogoTongaTrinidad and TobagoTunisiaTurkeyTurkmenistanTuvaluUgandaUkraineUnited Arab EmiratesUnited KingdomUnited StatesUruguayUzbekistanVanuatuVenezuela, RBVietnamWest Bank and GazaYemen, Rep.ZambiaZimbabwe Timeline:
This timeline shows a graph from 1993 to 2016 of Kazakhstan. No data until 1992. Number of actual observations by date: 24.
Source name:
World Development Indicators
Source organization:
World Bank national accounts data, and OECD National Accounts data files.
Categories, topics:
Economy & Growth
Last updated:
apr 23, 2017
Indicators value changes by year
Minimum:
940.0 mln
jan 1, 1993
Maximum:
13.176 trl
jan 1, 2015
At the date of observation
Value
Absolute change
Change from previous value
jan 1, 1993
940.0 mln
+940.0 mln
0.0%
jan 1, 1994
10.883 bln
+9.944 bln
1.06K%
jan 1, 1995
163.877 bln
+152.994 bln
1.41K%
jan 1, 1996
304.234 bln
+140.357 bln
85.65%
jan 1, 1997
362.259 bln
+58.025 bln
19.07%
jan 1, 1998
428.175 bln
+65.916 bln
18.2%
jan 1, 1999
508.1 bln
+79.925 bln
18.67%
jan 1, 2000
664.758 bln
+156.659 bln
30.83%
jan 1, 2001
982.134 bln
+317.376 bln
47.74%
jan 1, 2002
1.175 trl
+192.69 bln
19.62%
jan 1, 2003
1.352 trl
+177.496 bln
15.11%
jan 1, 2004
1.618 trl
+265.342 bln
19.62%
jan 1, 2005
2.075 trl
+457.538 bln
28.28%
jan 1, 2006
2.856 trl
+780.989 bln
37.63%
jan 1, 2007
4.02 trl
+1.164 trl
40.74%
jan 1, 2008
4.848 trl
+828.58 bln
20.61%
jan 1, 2009
6.461 trl
+1.613 trl
33.27%
jan 1, 2010
6.536 trl
+74.951 bln
1.16%
jan 1, 2011
8.858 trl
+2.321 trl
35.51%
jan 1, 2012
10.525 trl
+1.667 trl
18.83%
jan 1, 2013
11.259 trl
+734.317 bln
6.98%
jan 1, 2014
12.131 trl
+871.847 bln
7.74%
jan 1, 2015
13.176 trl
+1.045 trl
8.61%
jan 1, 2016
12.615 trl
-561.404 bln
-4.26%
Ranking of countries by current statistics by years


Comments: