29
/
en
AIzaSyAYiBZKx7MnpbEhh9jyipgxe19OcubqV5w
April 1, 2024
232337
Samoa
WSM
true
2
1
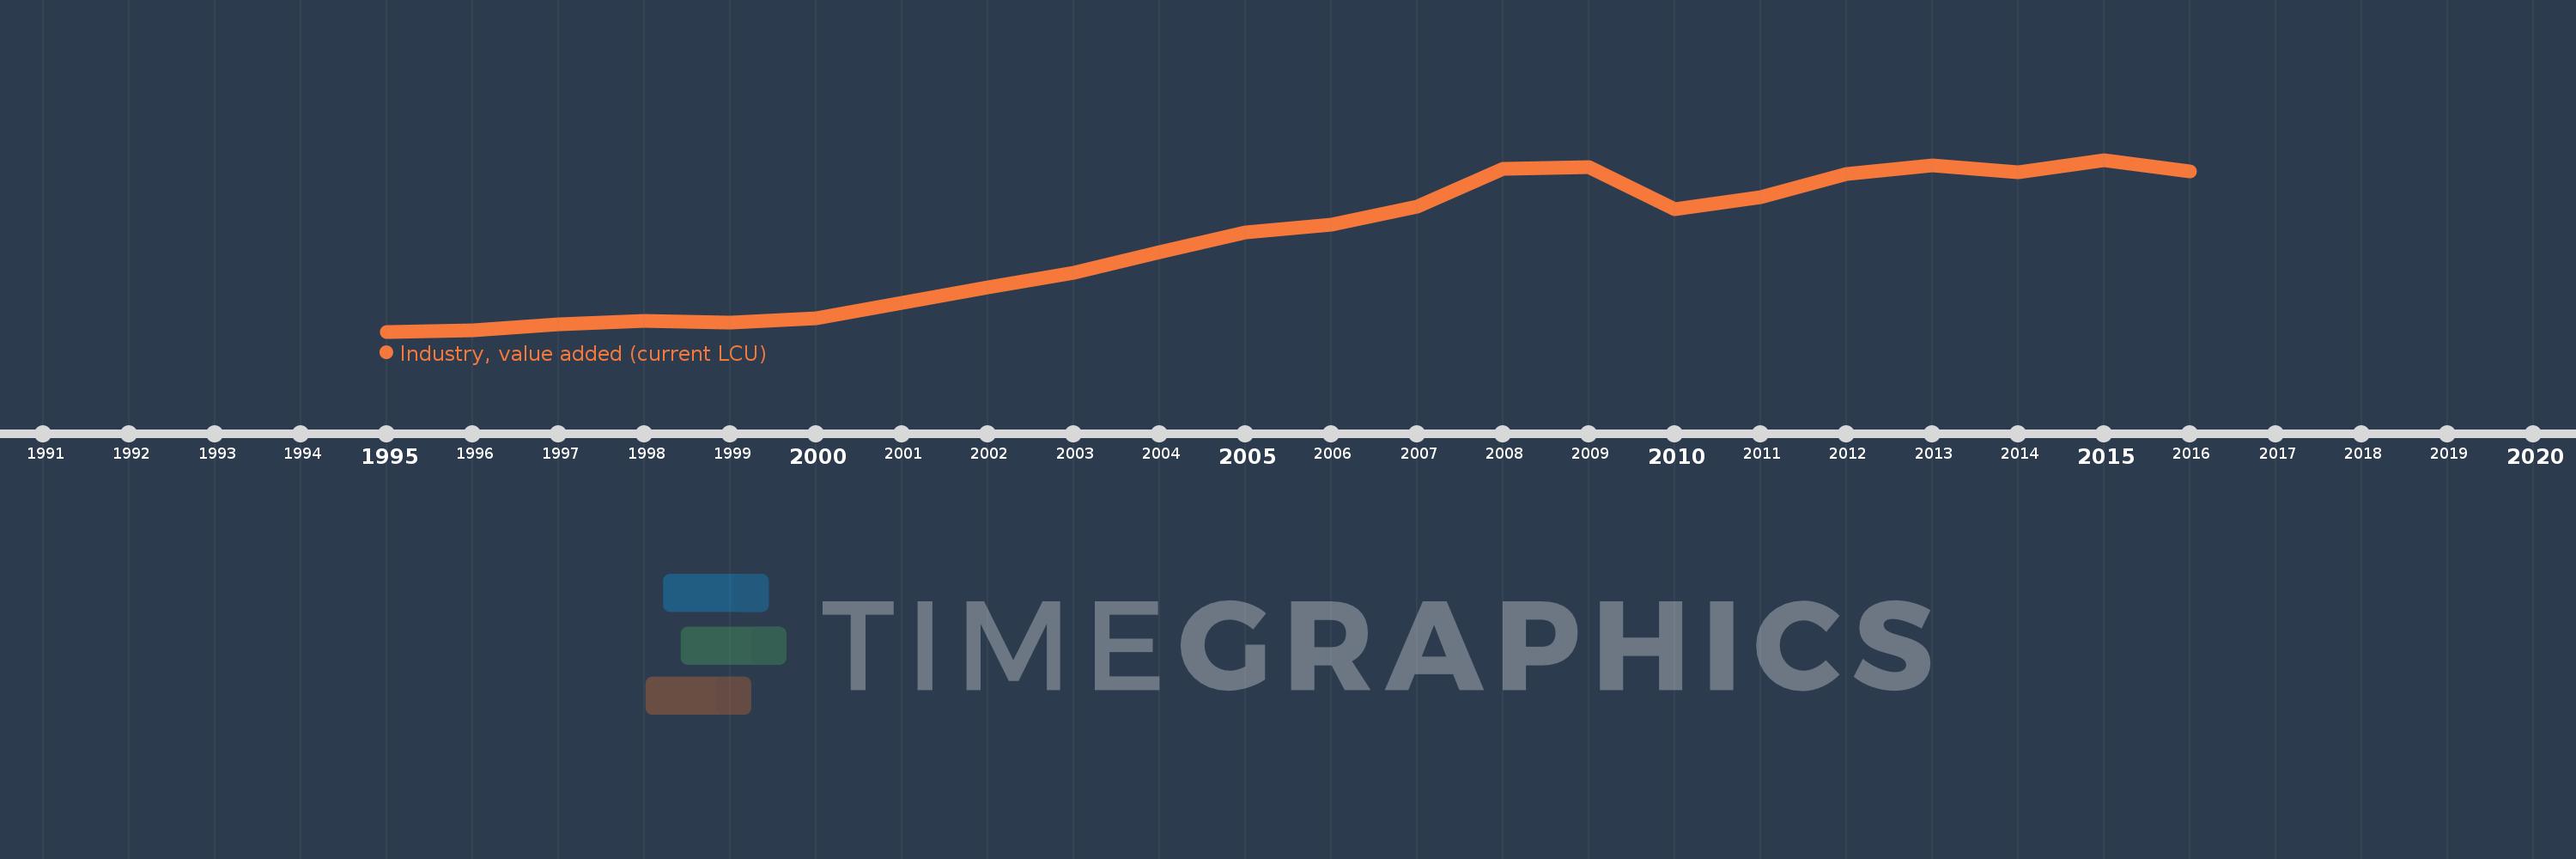
Industry, value added (current LCU)
2016,2015,2014,2013,2012,2011,2010,2009,2008,2007,2006,2005,2004,2003,2002,2001,2000,1999,1998,1997,1996,1995
This statistics in other country:
AfghanistanAlbaniaAlgeriaAndorraAngolaAntigua and BarbudaArgentinaArmeniaArubaAustraliaAustriaAzerbaijanBahamas, TheBahrainBangladeshBarbadosBelarusBelgiumBelizeBeninBermudaBhutanBoliviaBosnia and HerzegovinaBotswanaBrazilBrunei DarussalamBulgariaBurkina FasoBurundiCabo VerdeCambodiaCameroonCanadaCayman IslandsCentral African RepublicChadChileChinaColombiaComorosCongo, Dem. Rep.Congo, Rep.Costa RicaCote d'IvoireCroatiaCubaCyprusCzech RepublicDenmarkDjiboutiDominicaDominican RepublicEcuadorEgypt, Arab Rep.El SalvadorEquatorial GuineaEritreaEstoniaEthiopiaFijiFinlandFranceGabonGambia, TheGeorgiaGermanyGhanaGreeceGrenadaGuatemalaGuineaGuinea-BissauGuyanaHondurasHong Kong SAR, ChinaHungaryIcelandIndiaIndonesiaIran, Islamic Rep.IraqIrelandItalyJamaicaJapanJordanKazakhstanKenyaKiribatiKorea, Rep.KosovoKuwaitKyrgyz RepublicLao PDRLatviaLebanonLesothoLiberiaLibyaLiechtensteinLithuaniaLuxembourgMacao SAR, ChinaMacedonia, FYRMadagascarMalawiMalaysiaMaldivesMaliMaltaMarshall IslandsMauritaniaMauritiusMexicoMicronesia, Fed. Sts.MoldovaMongoliaMontenegroMoroccoMozambiqueMyanmarNamibiaNepalNetherlandsNew CaledoniaNew ZealandNicaraguaNigerNigeriaNorwayOmanPakistanPalauPanamaPapua New GuineaParaguayPeruPhilippinesPolandPortugalPuerto RicoQatarRomaniaRussian FederationRwandaSamoaSao Tome and PrincipeSaudi ArabiaSenegalSerbiaSeychellesSierra LeoneSingaporeSlovak RepublicSloveniaSolomon IslandsSomaliaSouth AfricaSpainSri LankaSt. Kitts and NevisSt. LuciaSt. Vincent and the GrenadinesSudanSurinameSwazilandSwedenSwitzerlandSyrian Arab RepublicTajikistanTanzaniaThailandTimor-LesteTogoTongaTrinidad and TobagoTunisiaTurkeyTurkmenistanTuvaluUgandaUkraineUnited Arab EmiratesUnited KingdomUnited StatesUruguayUzbekistanVanuatuVenezuela, RBVietnamWest Bank and GazaYemen, Rep.ZambiaZimbabwe Timeline:
This timeline shows a graph from 1995 to 2016 of Samoa. No data until 1994. Number of actual observations by date: 22.
Source name:
World Development Indicators
Source organization:
World Bank national accounts data, and OECD National Accounts data files.
Categories, topics:
Economy & Growth
Last updated:
apr 23, 2017
Indicators value changes by year
Minimum:
153.898 mln
jan 1, 1995
Maximum:
495.625 mln
jan 1, 2015
At the date of observation
Value
Absolute change
Change from previous value
jan 1, 1995
153.898 mln
+153.898 mln
0.0%
jan 1, 1996
156.532 mln
+2.634 mln
1.71%
jan 1, 1997
167.683 mln
+11.151 mln
7.12%
jan 1, 1998
174.72 mln
+7.037 mln
4.2%
jan 1, 1999
171.85 mln
-2.87 mln
-1.64%
jan 1, 2000
180.04 mln
+8.19 mln
4.77%
jan 1, 2001
211.102 mln
+31.063 mln
17.25%
jan 1, 2002
241.348 mln
+30.245 mln
14.33%
jan 1, 2003
271.092 mln
+29.745 mln
12.32%
jan 1, 2004
312.257 mln
+41.164 mln
15.18%
jan 1, 2005
351.012 mln
+38.756 mln
12.41%
jan 1, 2006
367.195 mln
+16.183 mln
4.61%
jan 1, 2007
402.28 mln
+35.084 mln
9.55%
jan 1, 2008
478.026 mln
+75.747 mln
18.83%
jan 1, 2009
481.45 mln
+3.424 mln
0.72%
jan 1, 2010
396.705 mln
-84.745 mln
-17.6%
jan 1, 2011
420.725 mln
+24.02 mln
6.05%
jan 1, 2012
467.466 mln
+46.741 mln
11.11%
jan 1, 2013
485.223 mln
+17.757 mln
3.8%
jan 1, 2014
471.492 mln
-13.731 mln
-2.83%
jan 1, 2015
495.625 mln
+24.133 mln
5.12%
jan 1, 2016
472.775 mln
-22.85 mln
-4.61%
Ranking of countries by current statistics by years


Comments: