29
/
en
AIzaSyAYiBZKx7MnpbEhh9jyipgxe19OcubqV5w
April 1, 2024
224991
Poland
POL
true
2
1
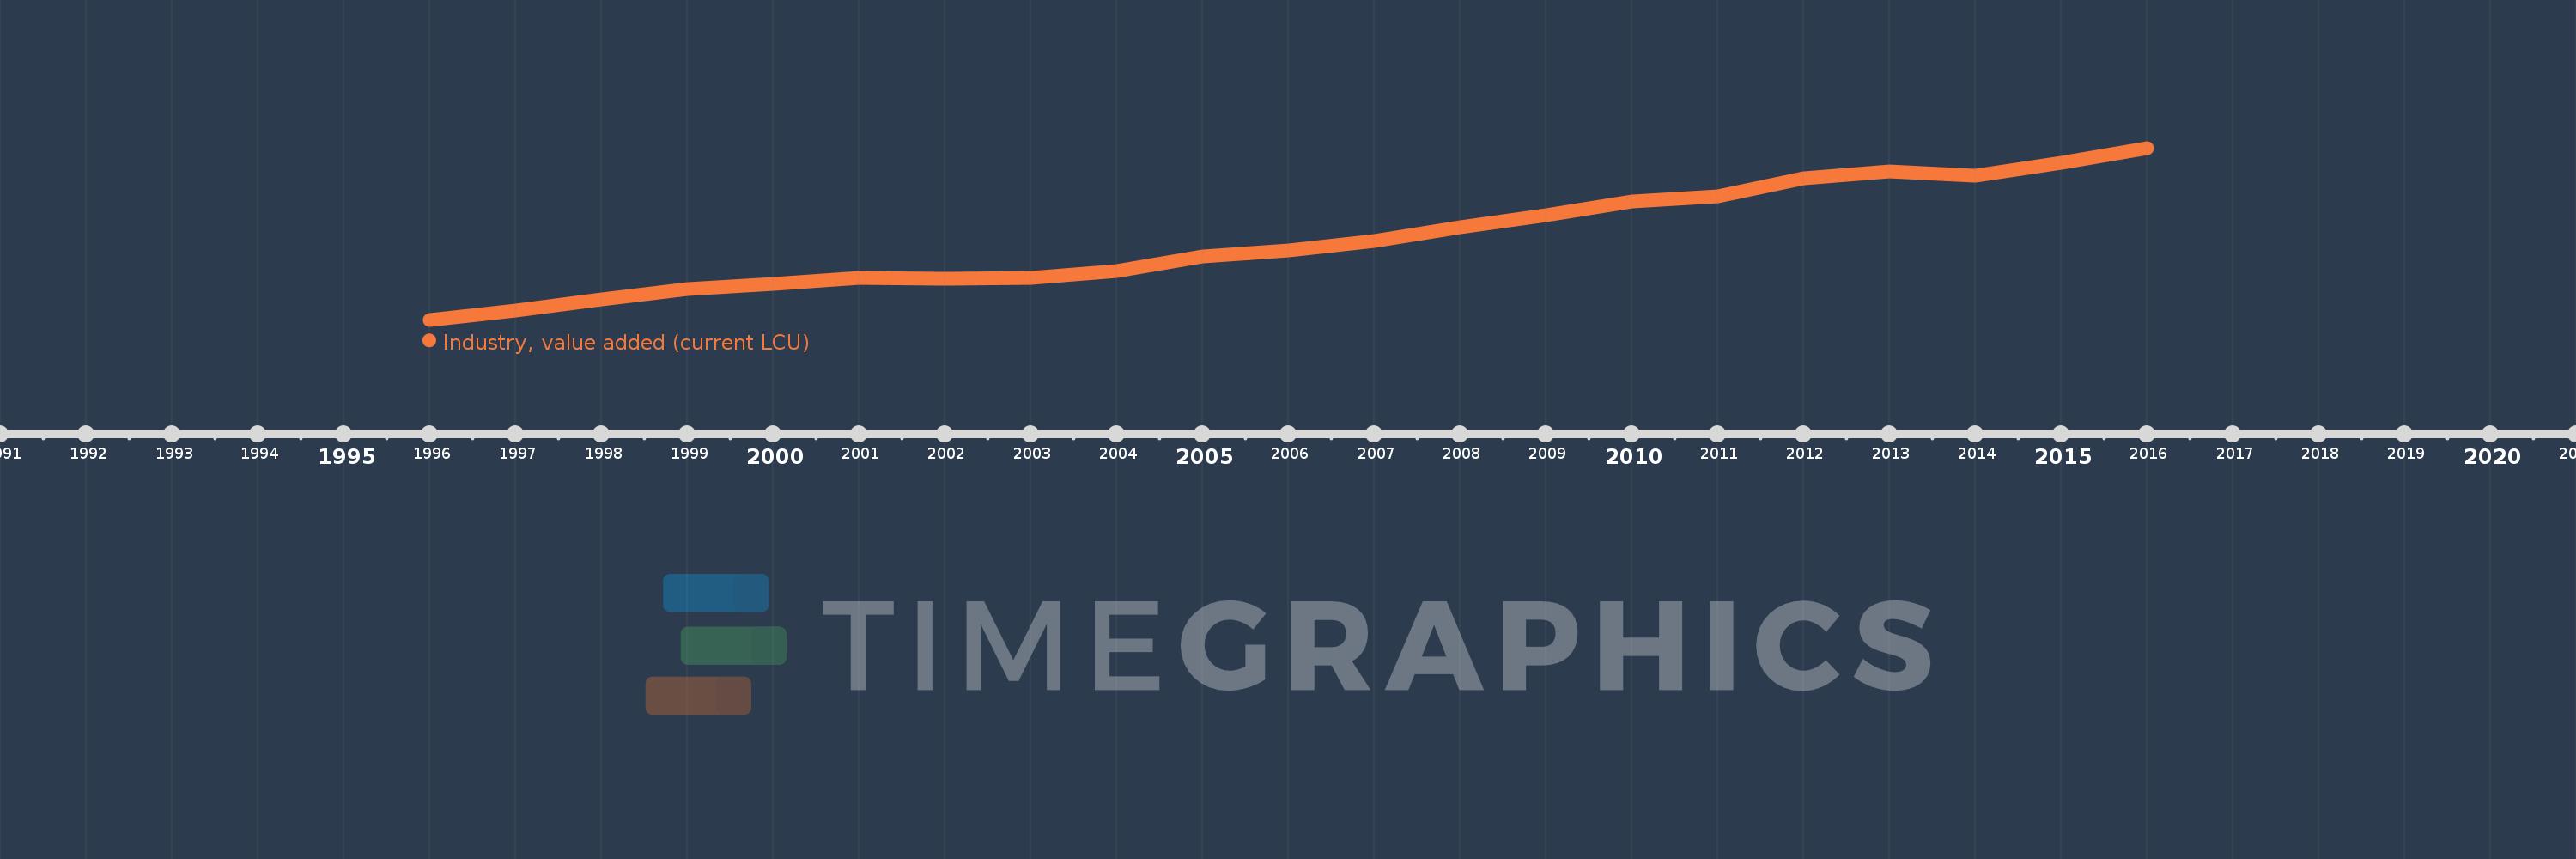
Industry, value added (current LCU)
2016,2015,2014,2013,2012,2011,2010,2009,2008,2007,2006,2005,2004,2003,2002,2001,2000,1999,1998,1997,1996
This statistics in other country:
AfghanistanAlbaniaAlgeriaAndorraAngolaAntigua and BarbudaArgentinaArmeniaArubaAustraliaAustriaAzerbaijanBahamas, TheBahrainBangladeshBarbadosBelarusBelgiumBelizeBeninBermudaBhutanBoliviaBosnia and HerzegovinaBotswanaBrazilBrunei DarussalamBulgariaBurkina FasoBurundiCabo VerdeCambodiaCameroonCanadaCayman IslandsCentral African RepublicChadChileChinaColombiaComorosCongo, Dem. Rep.Congo, Rep.Costa RicaCote d'IvoireCroatiaCubaCyprusCzech RepublicDenmarkDjiboutiDominicaDominican RepublicEcuadorEgypt, Arab Rep.El SalvadorEquatorial GuineaEritreaEstoniaEthiopiaFijiFinlandFranceGabonGambia, TheGeorgiaGermanyGhanaGreeceGrenadaGuatemalaGuineaGuinea-BissauGuyanaHondurasHong Kong SAR, ChinaHungaryIcelandIndiaIndonesiaIran, Islamic Rep.IraqIrelandItalyJamaicaJapanJordanKazakhstanKenyaKiribatiKorea, Rep.KosovoKuwaitKyrgyz RepublicLao PDRLatviaLebanonLesothoLiberiaLibyaLiechtensteinLithuaniaLuxembourgMacao SAR, ChinaMacedonia, FYRMadagascarMalawiMalaysiaMaldivesMaliMaltaMarshall IslandsMauritaniaMauritiusMexicoMicronesia, Fed. Sts.MoldovaMongoliaMontenegroMoroccoMozambiqueMyanmarNamibiaNepalNetherlandsNew CaledoniaNew ZealandNicaraguaNigerNigeriaNorwayOmanPakistanPalauPanamaPapua New GuineaParaguayPeruPhilippinesPolandPortugalPuerto RicoQatarRomaniaRussian FederationRwandaSamoaSao Tome and PrincipeSaudi ArabiaSenegalSerbiaSeychellesSierra LeoneSingaporeSlovak RepublicSloveniaSolomon IslandsSomaliaSouth AfricaSpainSri LankaSt. Kitts and NevisSt. LuciaSt. Vincent and the GrenadinesSudanSurinameSwazilandSwedenSwitzerlandSyrian Arab RepublicTajikistanTanzaniaThailandTimor-LesteTogoTongaTrinidad and TobagoTunisiaTurkeyTurkmenistanTuvaluUgandaUkraineUnited Arab EmiratesUnited KingdomUnited StatesUruguayUzbekistanVanuatuVenezuela, RBVietnamWest Bank and GazaYemen, Rep.ZambiaZimbabwe Timeline:
This timeline shows a graph from 1996 to 2016 of Poland. No data until 1995. Number of actual observations by date: 21.
Source name:
World Development Indicators
Source organization:
World Bank national accounts data, and OECD National Accounts data files.
Categories, topics:
Economy & Growth
Last updated:
apr 23, 2017
Indicators value changes by year
Minimum:
110.665 bln
jan 1, 1996
Maximum:
544.671 bln
jan 1, 2016
At the date of observation
Value
Absolute change
Change from previous value
jan 1, 1996
110.665 bln
+110.665 bln
0.0%
jan 1, 1997
132.924 bln
+22.259 bln
20.11%
jan 1, 1998
162.102 bln
+29.178 bln
21.95%
jan 1, 1999
188.352 bln
+26.25 bln
16.19%
jan 1, 2000
200.915 bln
+12.563 bln
6.67%
jan 1, 2001
215.768 bln
+14.853 bln
7.39%
jan 1, 2002
214.309 bln
-1.459 bln
-0.68%
jan 1, 2003
216.631 bln
+2.322 bln
1.08%
jan 1, 2004
232.841 bln
+16.21 bln
7.48%
jan 1, 2005
270.306 bln
+37.465 bln
16.09%
jan 1, 2006
285.507 bln
+15.201 bln
5.62%
jan 1, 2007
310.549 bln
+25.042 bln
8.77%
jan 1, 2008
344.059 bln
+33.51 bln
10.79%
jan 1, 2009
374.348 bln
+30.289 bln
8.8%
jan 1, 2010
408.995 bln
+34.647 bln
9.26%
jan 1, 2011
421.694 bln
+12.699 bln
3.1%
jan 1, 2012
467.421 bln
+45.727 bln
10.84%
jan 1, 2013
484.646 bln
+17.225 bln
3.69%
jan 1, 2014
474.236 bln
-10.41 bln
-2.15%
jan 1, 2015
506.332 bln
+32.096 bln
6.77%
jan 1, 2016
544.671 bln
+38.339 bln
7.57%
Ranking of countries by current statistics by years


Comments: