29
/
en
AIzaSyAYiBZKx7MnpbEhh9jyipgxe19OcubqV5w
April 1, 2024
281925
Vietnam
VNM
true
2
1
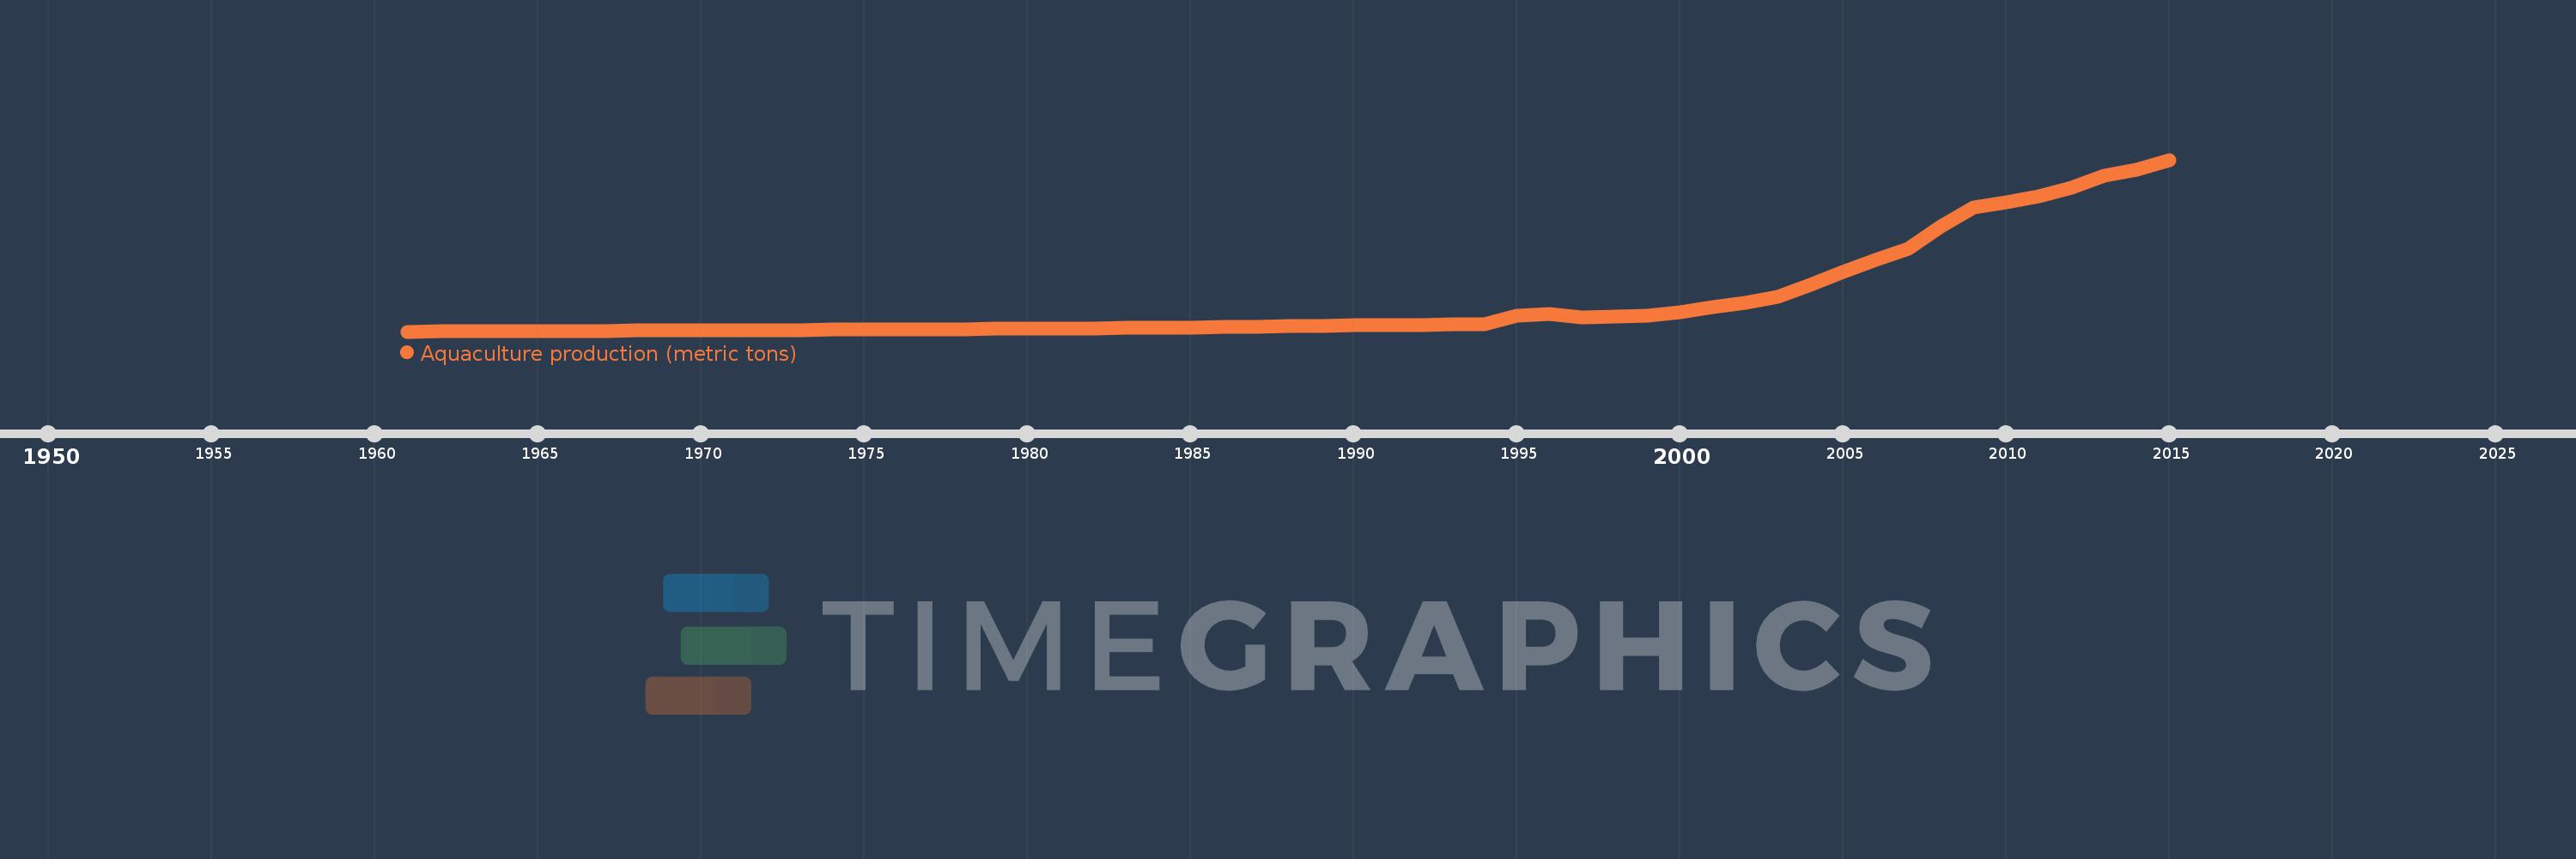
Aquaculture production (metric tons)
2015,2014,2013,2012,2011,2010,2009,2008,2007,2006,2005,2004,2003,2002,2001,2000,1999,1998,1997,1996,1995,1994,1993,1992,1991,1990,1989,1988,1987,1986,1985,1984,1983,1982,1981,1980,1979,1978,1977,1976,1975,1974,1973,1972,1971,1970,1969,1968,1967,1966,1965,1964,1963,1962,1961
This statistics in other country:
AfghanistanAlbaniaAlgeriaAmerican SamoaAngolaArab WorldArgentinaArmeniaArubaAustraliaAustriaAzerbaijanBahamas, TheBahrainBangladeshBarbadosBelarusBelgiumBelizeBeninBhutanBoliviaBosnia and HerzegovinaBrazilBrunei DarussalamBulgariaBurkina FasoBurundiCambodiaCameroonCanadaCaribbean small statesCentral African RepublicCentral Europe and the BalticsChadChannel IslandsChileChinaColombiaCongo, Dem. Rep.Congo, Rep.Costa RicaCote d'IvoireCroatiaCubaCyprusCzech RepublicDenmarkDominicaDominican RepublicEarly-demographic dividendEast Asia & PacificEast Asia & Pacific (excluding high income)East Asia & Pacific (IDA & IBRD countries)EcuadorEgypt, Arab Rep.El SalvadorEquatorial GuineaEritreaEstoniaEthiopiaEuro areaEurope & Central AsiaEurope & Central Asia (excluding high income)Europe & Central Asia (IDA & IBRD countries)European UnionFaroe IslandsFijiFinlandFragile and conflict affected situationsFranceFrench PolynesiaGabonGambia, TheGeorgiaGermanyGhanaGreeceGrenadaGuamGuatemalaGuineaGuyanaHaitiHeavily indebted poor countries (HIPC)High incomeHondurasHong Kong SAR, ChinaHungaryIBRD onlyIcelandIDA & IBRD totalIDA blendIDA onlyIDA totalIndiaIndonesiaIran, Islamic Rep.IraqIrelandIsraelItalyJamaicaJapanJordanKazakhstanKenyaKiribatiKorea, Dem. People’s Rep.Korea, Rep.KuwaitKyrgyz RepublicLao PDRLate-demographic dividendLatin America & Caribbean Latin America & Caribbean (excluding high income)Latin America & the Caribbean (IDA & IBRD countries)LatviaLeast developed countries: UN classificationLebanonLesothoLiberiaLibyaLithuaniaLow & middle incomeLow incomeLower middle incomeMacedonia, FYRMadagascarMalawiMalaysiaMaliMaltaMarshall IslandsMauritiusMexicoMicronesia, Fed. Sts.Middle East & North AfricaMiddle East & North Africa (excluding high income)Middle East & North Africa (IDA & IBRD countries)Middle incomeMoldovaMontenegroMoroccoMozambiqueMyanmarNamibiaNauruNepalNetherlandsNew CaledoniaNew ZealandNicaraguaNigerNigeriaNorth AmericaNorthern Mariana IslandsNorwayOECD membersOmanOther small statesPacific island small statesPakistanPalauPanamaPapua New GuineaParaguayPeruPhilippinesPolandPortugalPost-demographic dividendPre-demographic dividendPuerto RicoQatarRomaniaRussian FederationRwandaSamoaSaudi ArabiaSenegalSerbiaSeychellesSierra LeoneSingaporeSlovak RepublicSloveniaSmall statesSolomon IslandsSouth AfricaSouth AsiaSouth Asia (IDA & IBRD)South SudanSpainSri LankaSt. Kitts and NevisSt. LuciaSub-Saharan Africa Sub-Saharan Africa (excluding high income)Sub-Saharan Africa (IDA & IBRD countries)SudanSurinameSwazilandSwedenSwitzerlandSyrian Arab RepublicTajikistanTanzaniaThailandTimor-LesteTogoTongaTrinidad and TobagoTunisiaTurkeyTurkmenistanTurks and Caicos IslandsTuvaluUgandaUkraineUnited Arab EmiratesUnited KingdomUnited StatesUpper middle incomeUruguayUzbekistanVanuatuVenezuela, RBVietnamVirgin Islands (U.S.)West Bank and GazaWorldYemen, Rep.ZambiaZimbabwe Timeline:
This timeline shows a graph from 1961 to 2015 of Vietnam. No data until 1960. Number of actual observations by date: 55.
Source name:
World Development Indicators
Source organization:
Food and Agriculture Organization.
Categories, topics:
Environment
Last updated:
apr 23, 2017
Indicators value changes by year
Minimum:
37.66K
jan 1, 1961
Maximum:
3.411 mln
jan 1, 2015
At the date of observation
Value
Absolute change
Change from previous value
jan 1, 1961
37.66K
+37.66K
0.0%
jan 1, 1962
40.32K
+2.66K
7.06%
jan 1, 1963
43.04K
+2.72K
6.75%
jan 1, 1964
45.75K
+2.71K
6.3%
jan 1, 1965
48.54K
+2.79K
6.1%
jan 1, 1966
51.33K
+2.79K
5.75%
jan 1, 1967
54.13K
+2.8K
5.45%
jan 1, 1968
56.85K
+2.72K
5.02%
jan 1, 1969
59.58K
+2.73K
4.8%
jan 1, 1970
62.44K
+2.86K
4.8%
jan 1, 1971
65.35K
+2.91K
4.66%
jan 1, 1972
68.36K
+3.01K
4.61%
jan 1, 1973
71.23K
+2.87K
4.2%
jan 1, 1974
74.25K
+3.02K
4.24%
jan 1, 1975
77.22K
+2.97K
4.0%
jan 1, 1976
80.39K
+3.17K
4.11%
jan 1, 1977
83.58K
+3.19K
3.97%
jan 1, 1978
87.02K
+3.44K
4.12%
jan 1, 1979
90.76K
+3.74K
4.3%
jan 1, 1980
94.69K
+3.93K
4.33%
jan 1, 1981
99.16K
+4.47K
4.72%
jan 1, 1982
103.81K
+4.65K
4.69%
jan 1, 1983
108.77K
+4.96K
4.78%
jan 1, 1984
113.92K
+5.15K
4.73%
jan 1, 1985
119.0K
+5.08K
4.46%
jan 1, 1986
129.5K
+10.5K
8.82%
jan 1, 1987
127.449K
-2.051K
-1.58%
jan 1, 1988
141.747K
+14.298K
11.22%
jan 1, 1989
154.317K
+12.57K
8.87%
jan 1, 1990
164.917K
+10.6K
6.87%
jan 1, 1991
162.076K
-2.841K
-1.72%
jan 1, 1992
168.104K
+6.028K
3.72%
jan 1, 1993
172.899K
+4.795K
2.85%
jan 1, 1994
188.061K
+15.162K
8.77%
jan 1, 1995
344.084K
+156.023K
82.96%
jan 1, 1996
389.069K
+44.985K
13.07%
jan 1, 1997
308.288K
-80.781K
-20.76%
jan 1, 1998
332.378K
+24.09K
7.81%
jan 1, 1999
353.92K
+21.542K
6.48%
jan 1, 2000
413.468K
+59.548K
16.83%
jan 1, 2001
513.517K
+100.049K
24.2%
jan 1, 2002
603.098K
+89.581K
17.44%
jan 1, 2003
718.041K
+114.943K
19.06%
jan 1, 2004
952.502K
+234.461K
32.65%
jan 1, 2005
1.214 mln
+261.115K
27.41%
jan 1, 2006
1.452 mln
+238.683K
19.67%
jan 1, 2007
1.673 mln
+220.427K
15.18%
jan 1, 2008
2.1 mln
+427.673K
25.57%
jan 1, 2009
2.477 mln
+377.05K
17.95%
jan 1, 2010
2.571 mln
+93.63K
3.78%
jan 1, 2011
2.689 mln
+117.737K
4.58%
jan 1, 2012
2.86 mln
+170.764K
6.35%
jan 1, 2013
3.103 mln
+243.77K
8.52%
jan 1, 2014
3.22 mln
+116.72K
3.76%
jan 1, 2015
3.411 mln
+191.32K
5.94%
Ranking of countries by current statistics by years


Comments: