29
/
en
AIzaSyAYiBZKx7MnpbEhh9jyipgxe19OcubqV5w
April 1, 2024
53940
Pacific island small states
PSS
false
2
1
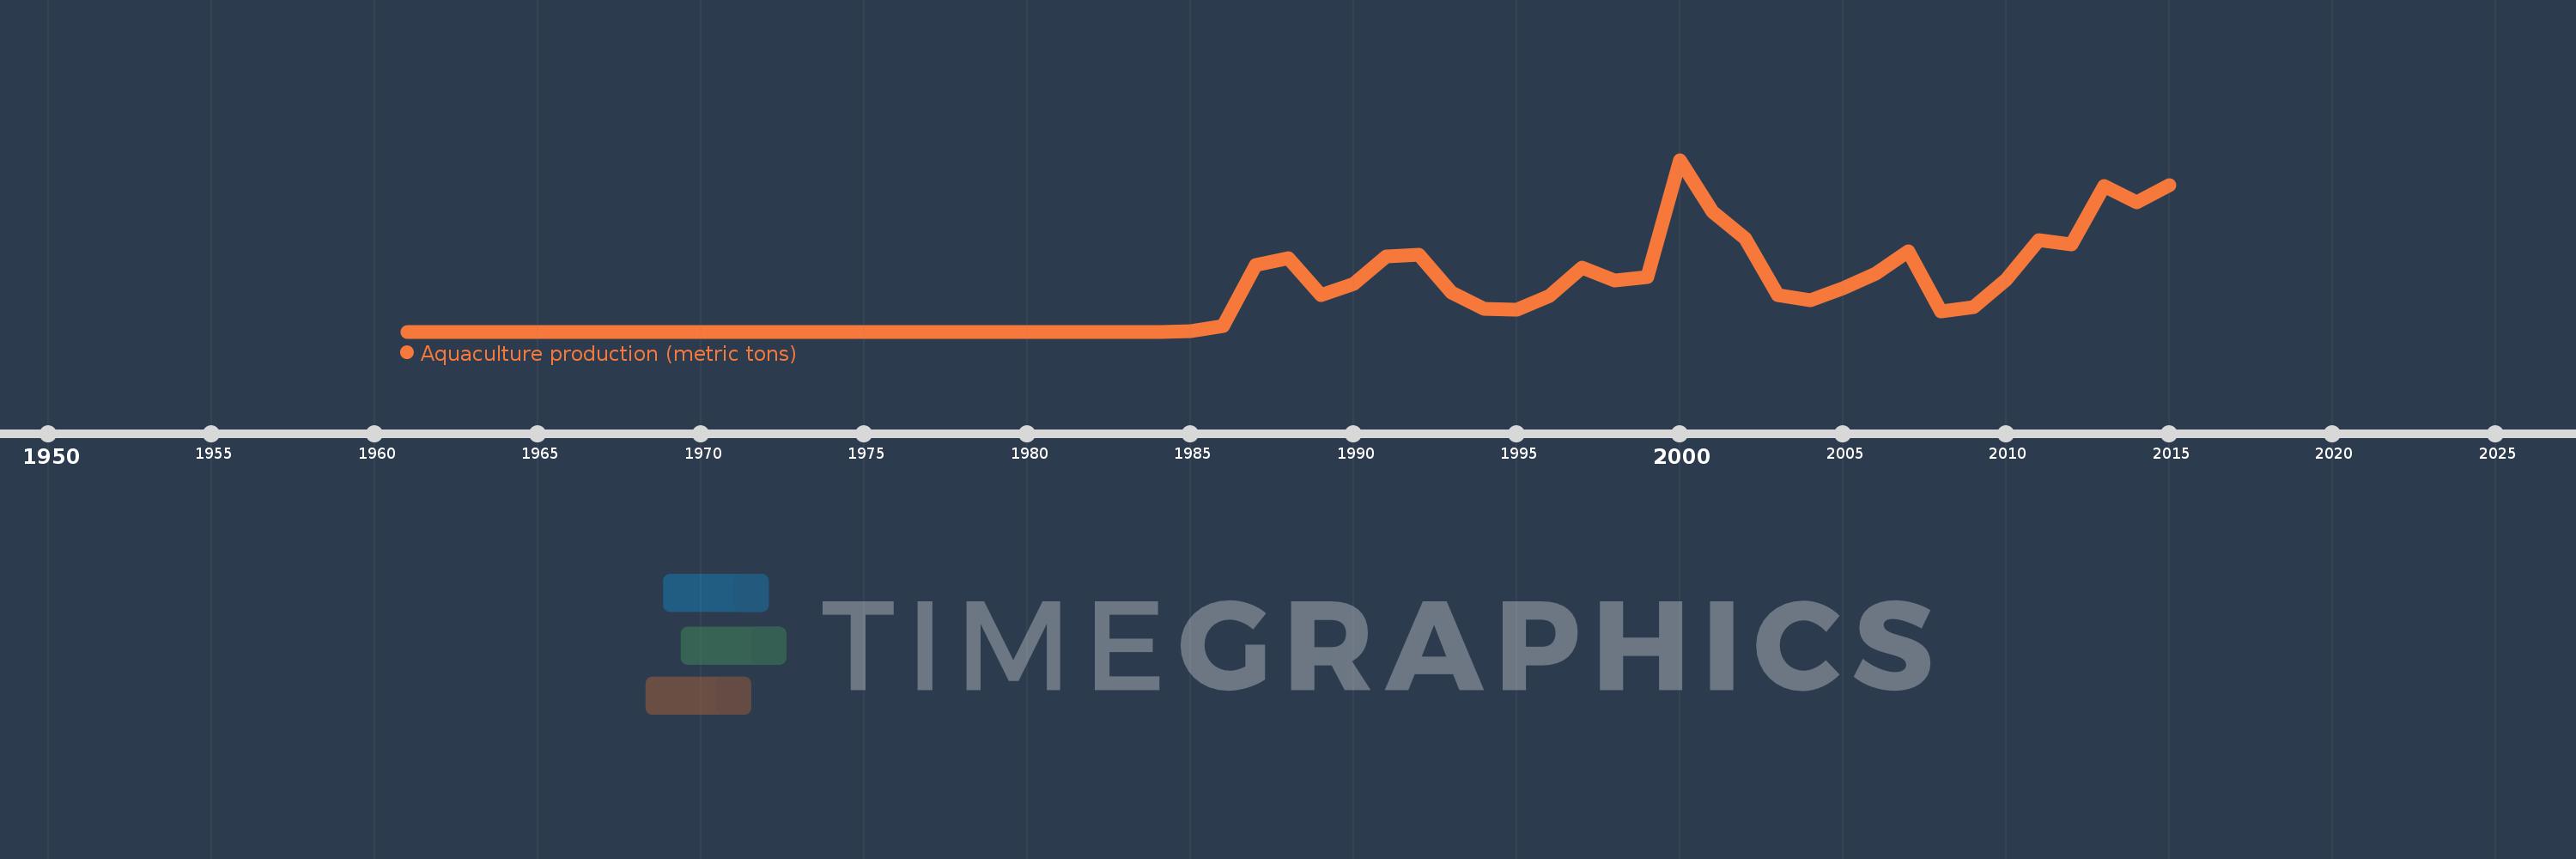
Aquaculture production (metric tons)
2015,2014,2013,2012,2011,2010,2009,2008,2007,2006,2005,2004,2003,2002,2001,2000,1999,1998,1997,1996,1995,1994,1993,1992,1991,1990,1989,1988,1987,1986,1985,1984,1983,1982,1981,1980,1979,1978,1977,1976,1975,1974,1973,1972,1971,1970,1969,1968,1967,1966,1965,1964,1963,1962,1961
This statistics in other country:
AfghanistanAlbaniaAlgeriaAmerican SamoaAngolaArab WorldArgentinaArmeniaArubaAustraliaAustriaAzerbaijanBahamas, TheBahrainBangladeshBarbadosBelarusBelgiumBelizeBeninBhutanBoliviaBosnia and HerzegovinaBrazilBrunei DarussalamBulgariaBurkina FasoBurundiCambodiaCameroonCanadaCaribbean small statesCentral African RepublicCentral Europe and the BalticsChadChannel IslandsChileChinaColombiaCongo, Dem. Rep.Congo, Rep.Costa RicaCote d'IvoireCroatiaCubaCyprusCzech RepublicDenmarkDominicaDominican RepublicEarly-demographic dividendEast Asia & PacificEast Asia & Pacific (excluding high income)East Asia & Pacific (IDA & IBRD countries)EcuadorEgypt, Arab Rep.El SalvadorEquatorial GuineaEritreaEstoniaEthiopiaEuro areaEurope & Central AsiaEurope & Central Asia (excluding high income)Europe & Central Asia (IDA & IBRD countries)European UnionFaroe IslandsFijiFinlandFragile and conflict affected situationsFranceFrench PolynesiaGabonGambia, TheGeorgiaGermanyGhanaGreeceGrenadaGuamGuatemalaGuineaGuyanaHaitiHeavily indebted poor countries (HIPC)High incomeHondurasHong Kong SAR, ChinaHungaryIBRD onlyIcelandIDA & IBRD totalIDA blendIDA onlyIDA totalIndiaIndonesiaIran, Islamic Rep.IraqIrelandIsraelItalyJamaicaJapanJordanKazakhstanKenyaKiribatiKorea, Dem. People’s Rep.Korea, Rep.KuwaitKyrgyz RepublicLao PDRLate-demographic dividendLatin America & Caribbean Latin America & Caribbean (excluding high income)Latin America & the Caribbean (IDA & IBRD countries)LatviaLeast developed countries: UN classificationLebanonLesothoLiberiaLibyaLithuaniaLow & middle incomeLow incomeLower middle incomeMacedonia, FYRMadagascarMalawiMalaysiaMaliMaltaMarshall IslandsMauritiusMexicoMicronesia, Fed. Sts.Middle East & North AfricaMiddle East & North Africa (excluding high income)Middle East & North Africa (IDA & IBRD countries)Middle incomeMoldovaMontenegroMoroccoMozambiqueMyanmarNamibiaNauruNepalNetherlandsNew CaledoniaNew ZealandNicaraguaNigerNigeriaNorth AmericaNorthern Mariana IslandsNorwayOECD membersOmanOther small statesPacific island small statesPakistanPalauPanamaPapua New GuineaParaguayPeruPhilippinesPolandPortugalPost-demographic dividendPre-demographic dividendPuerto RicoQatarRomaniaRussian FederationRwandaSamoaSaudi ArabiaSenegalSerbiaSeychellesSierra LeoneSingaporeSlovak RepublicSloveniaSmall statesSolomon IslandsSouth AfricaSouth AsiaSouth Asia (IDA & IBRD)South SudanSpainSri LankaSt. Kitts and NevisSt. LuciaSub-Saharan Africa Sub-Saharan Africa (excluding high income)Sub-Saharan Africa (IDA & IBRD countries)SudanSurinameSwazilandSwedenSwitzerlandSyrian Arab RepublicTajikistanTanzaniaThailandTimor-LesteTogoTongaTrinidad and TobagoTunisiaTurkeyTurkmenistanTurks and Caicos IslandsTuvaluUgandaUkraineUnited Arab EmiratesUnited KingdomUnited StatesUpper middle incomeUruguayUzbekistanVanuatuVenezuela, RBVietnamVirgin Islands (U.S.)West Bank and GazaWorldYemen, Rep.ZambiaZimbabwe Timeline:
This timeline shows a graph from 1961 to 2015 of Pacific island small states. No data until 1960. Number of actual observations by date: 55.
Source name:
World Development Indicators
Source organization:
Food and Agriculture Organization.
Categories, topics:
Environment
Last updated:
apr 23, 2017
Indicators value changes by year
Maximum:
26.287K
jan 1, 2000
At the date of observation
Value
Absolute change
Change from previous value
jan 1, 1986
857.0
+810.0
1.72K%
jan 1, 1987
10.191K
+9.334K
1.09K%
jan 1, 1988
11.252K
+1.061K
10.41%
jan 1, 1989
5.538K
-5.714K
-50.78%
jan 1, 1990
7.28K
+1.742K
31.46%
jan 1, 1991
11.476K
+4.196K
57.64%
jan 1, 1992
11.71K
+234.0
2.04%
jan 1, 1993
6.022K
-5.688K
-48.57%
jan 1, 1994
3.528K
-2.494K
-41.41%
jan 1, 1995
3.4K
-128.034
-3.63%
jan 1, 1996
5.481K
+2.081K
61.21%
jan 1, 1997
9.759K
+4.278K
78.05%
jan 1, 1998
7.764K
-1.995K
-20.44%
jan 1, 1999
8.37K
+606.0
7.81%
jan 1, 2000
26.287K
+17.917K
214.06%
jan 1, 2001
18.273K
-8.014K
-30.49%
jan 1, 2002
14.296K
-3.977K
-21.76%
jan 1, 2003
5.545K
-8.751K
-61.21%
jan 1, 2004
4.788K
-757.0
-13.65%
jan 1, 2005
6.654K
+1.867K
38.98%
jan 1, 2006
8.921K
+2.267K
34.07%
jan 1, 2007
12.283K
+3.361K
37.68%
jan 1, 2008
3.087K
-9.196K
-74.87%
jan 1, 2009
3.789K
+702.25
22.75%
jan 1, 2010
7.956K
+4.167K
109.98%
jan 1, 2011
13.962K
+6.006K
75.5%
jan 1, 2012
13.328K
-633.53
-4.54%
jan 1, 2013
22.307K
+8.979K
67.37%
jan 1, 2014
19.742K
-2.565K
-11.5%
jan 1, 2015
22.453K
+2.711K
13.73%
Ranking of countries by current statistics by years


Comments: