29
/
en
AIzaSyAYiBZKx7MnpbEhh9jyipgxe19OcubqV5w
April 1, 2024
56047
Small states
SST
false
2
1
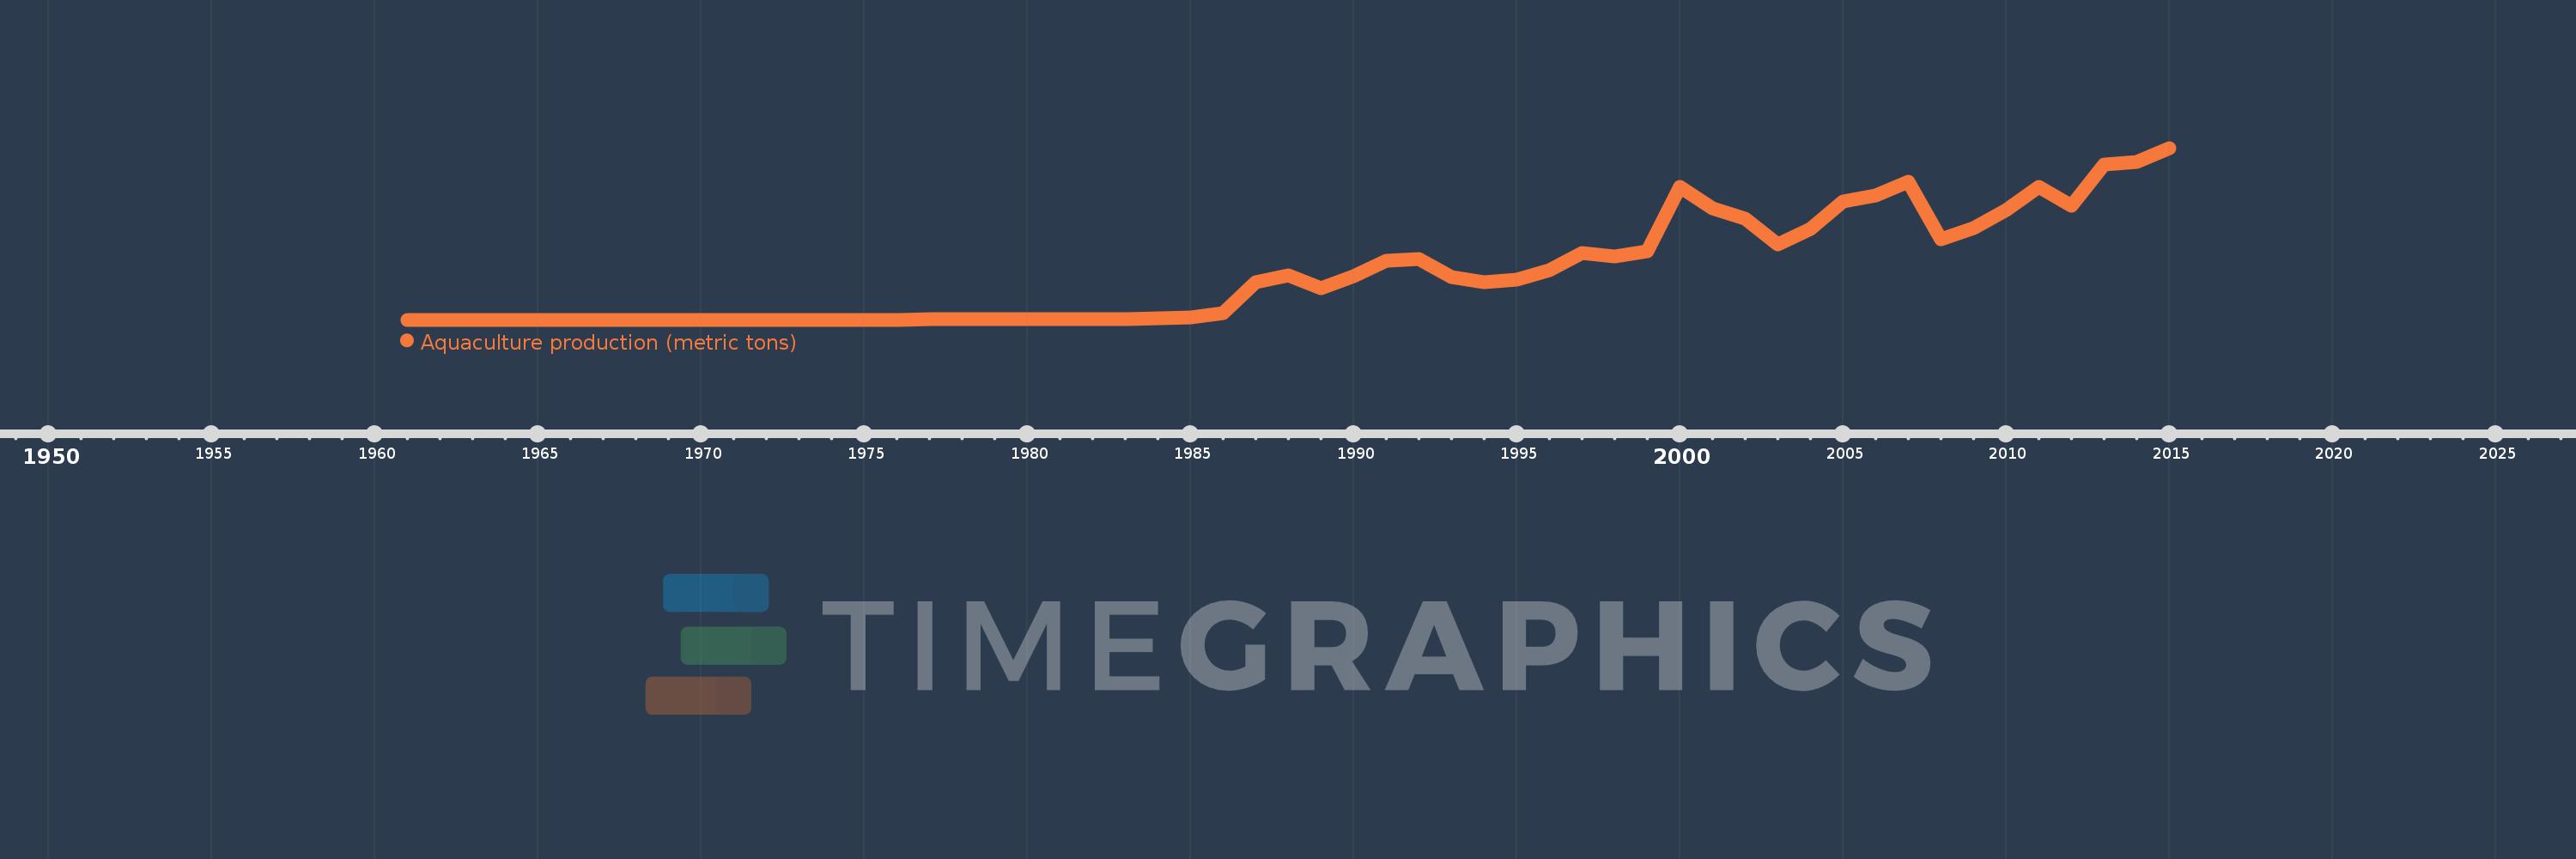
Aquaculture production (metric tons)
2015,2014,2013,2012,2011,2010,2009,2008,2007,2006,2005,2004,2003,2002,2001,2000,1999,1998,1997,1996,1995,1994,1993,1992,1991,1990,1989,1988,1987,1986,1985,1984,1983,1982,1981,1980,1979,1978,1977,1976,1975,1974,1973,1972,1971,1970,1969,1968,1967,1966,1965,1964,1963,1962,1961
This statistics in other country:
AfghanistanAlbaniaAlgeriaAmerican SamoaAngolaArab WorldArgentinaArmeniaArubaAustraliaAustriaAzerbaijanBahamas, TheBahrainBangladeshBarbadosBelarusBelgiumBelizeBeninBhutanBoliviaBosnia and HerzegovinaBrazilBrunei DarussalamBulgariaBurkina FasoBurundiCambodiaCameroonCanadaCaribbean small statesCentral African RepublicCentral Europe and the BalticsChadChannel IslandsChileChinaColombiaCongo, Dem. Rep.Congo, Rep.Costa RicaCote d'IvoireCroatiaCubaCyprusCzech RepublicDenmarkDominicaDominican RepublicEarly-demographic dividendEast Asia & PacificEast Asia & Pacific (excluding high income)East Asia & Pacific (IDA & IBRD countries)EcuadorEgypt, Arab Rep.El SalvadorEquatorial GuineaEritreaEstoniaEthiopiaEuro areaEurope & Central AsiaEurope & Central Asia (excluding high income)Europe & Central Asia (IDA & IBRD countries)European UnionFaroe IslandsFijiFinlandFragile and conflict affected situationsFranceFrench PolynesiaGabonGambia, TheGeorgiaGermanyGhanaGreeceGrenadaGuamGuatemalaGuineaGuyanaHaitiHeavily indebted poor countries (HIPC)High incomeHondurasHong Kong SAR, ChinaHungaryIBRD onlyIcelandIDA & IBRD totalIDA blendIDA onlyIDA totalIndiaIndonesiaIran, Islamic Rep.IraqIrelandIsraelItalyJamaicaJapanJordanKazakhstanKenyaKiribatiKorea, Dem. People’s Rep.Korea, Rep.KuwaitKyrgyz RepublicLao PDRLate-demographic dividendLatin America & Caribbean Latin America & Caribbean (excluding high income)Latin America & the Caribbean (IDA & IBRD countries)LatviaLeast developed countries: UN classificationLebanonLesothoLiberiaLibyaLithuaniaLow & middle incomeLow incomeLower middle incomeMacedonia, FYRMadagascarMalawiMalaysiaMaliMaltaMarshall IslandsMauritiusMexicoMicronesia, Fed. Sts.Middle East & North AfricaMiddle East & North Africa (excluding high income)Middle East & North Africa (IDA & IBRD countries)Middle incomeMoldovaMontenegroMoroccoMozambiqueMyanmarNamibiaNauruNepalNetherlandsNew CaledoniaNew ZealandNicaraguaNigerNigeriaNorth AmericaNorthern Mariana IslandsNorwayOECD membersOmanOther small statesPacific island small statesPakistanPalauPanamaPapua New GuineaParaguayPeruPhilippinesPolandPortugalPost-demographic dividendPre-demographic dividendPuerto RicoQatarRomaniaRussian FederationRwandaSamoaSaudi ArabiaSenegalSerbiaSeychellesSierra LeoneSingaporeSlovak RepublicSloveniaSmall statesSolomon IslandsSouth AfricaSouth AsiaSouth Asia (IDA & IBRD)South SudanSpainSri LankaSt. Kitts and NevisSt. LuciaSub-Saharan Africa Sub-Saharan Africa (excluding high income)Sub-Saharan Africa (IDA & IBRD countries)SudanSurinameSwazilandSwedenSwitzerlandSyrian Arab RepublicTajikistanTanzaniaThailandTimor-LesteTogoTongaTrinidad and TobagoTunisiaTurkeyTurkmenistanTurks and Caicos IslandsTuvaluUgandaUkraineUnited Arab EmiratesUnited KingdomUnited StatesUpper middle incomeUruguayUzbekistanVanuatuVenezuela, RBVietnamVirgin Islands (U.S.)West Bank and GazaWorldYemen, Rep.ZambiaZimbabwe Timeline:
This timeline shows a graph from 1961 to 2015 of Small states. No data until 1960. Number of actual observations by date: 55.
Source name:
World Development Indicators
Source organization:
Food and Agriculture Organization.
Categories, topics:
Environment
Last updated:
apr 23, 2017
Indicators value changes by year
Maximum:
56.004K
jan 1, 2015
At the date of observation
Value
Absolute change
Change from previous value
jan 1, 1976
56.0
+5.0
9.8%
jan 1, 1977
66.0
+10.0
17.86%
jan 1, 1978
71.0
+5.0
7.58%
jan 1, 1979
121.0
+50.0
70.42%
jan 1, 1980
130.0
+9.0
7.44%
jan 1, 1981
133.0
+3.0
2.31%
jan 1, 1982
167.0
+34.0
25.56%
jan 1, 1983
310.0
+143.0
85.63%
jan 1, 1984
363.0
+53.0
17.1%
jan 1, 1985
691.0
+328.0
90.36%
jan 1, 1986
2.125K
+1.434K
207.53%
jan 1, 1987
12.309K
+10.184K
479.25%
jan 1, 1988
14.475K
+2.166K
17.6%
jan 1, 1989
10.25K
-4.225K
-29.19%
jan 1, 1990
14.279K
+4.029K
39.31%
jan 1, 1991
19.293K
+5.014K
35.11%
jan 1, 1992
19.879K
+586.0
3.04%
jan 1, 1993
13.849K
-6.03K
-30.33%
jan 1, 1994
12.194K
-1.655K
-11.95%
jan 1, 1995
13.143K
+948.966
7.78%
jan 1, 1996
16.138K
+2.995K
22.79%
jan 1, 1997
21.68K
+5.542K
34.34%
jan 1, 1998
20.69K
-990.0
-4.57%
jan 1, 1999
22.353K
+1.663K
8.04%
jan 1, 2000
43.316K
+20.963K
93.78%
jan 1, 2001
36.251K
-7.065K
-16.31%
jan 1, 2002
33.044K
-3.207K
-8.85%
jan 1, 2003
24.673K
-8.371K
-25.33%
jan 1, 2004
29.716K
+5.043K
20.44%
jan 1, 2005
38.561K
+8.845K
29.77%
jan 1, 2006
40.626K
+2.065K
5.36%
jan 1, 2007
45.103K
+4.477K
11.02%
jan 1, 2008
26.148K
-18.955K
-42.03%
jan 1, 2009
29.803K
+3.655K
13.98%
jan 1, 2010
35.672K
+5.869K
19.69%
jan 1, 2011
43.384K
+7.712K
21.62%
jan 1, 2012
37.192K
-6.191K
-14.27%
jan 1, 2013
50.619K
+13.426K
36.1%
jan 1, 2014
51.397K
+778.327
1.54%
jan 1, 2015
56.004K
+4.607K
8.96%
Ranking of countries by current statistics by years


Comments: