29
/
en
AIzaSyAYiBZKx7MnpbEhh9jyipgxe19OcubqV5w
April 1, 2024
105688
China
CHN
true
2
1
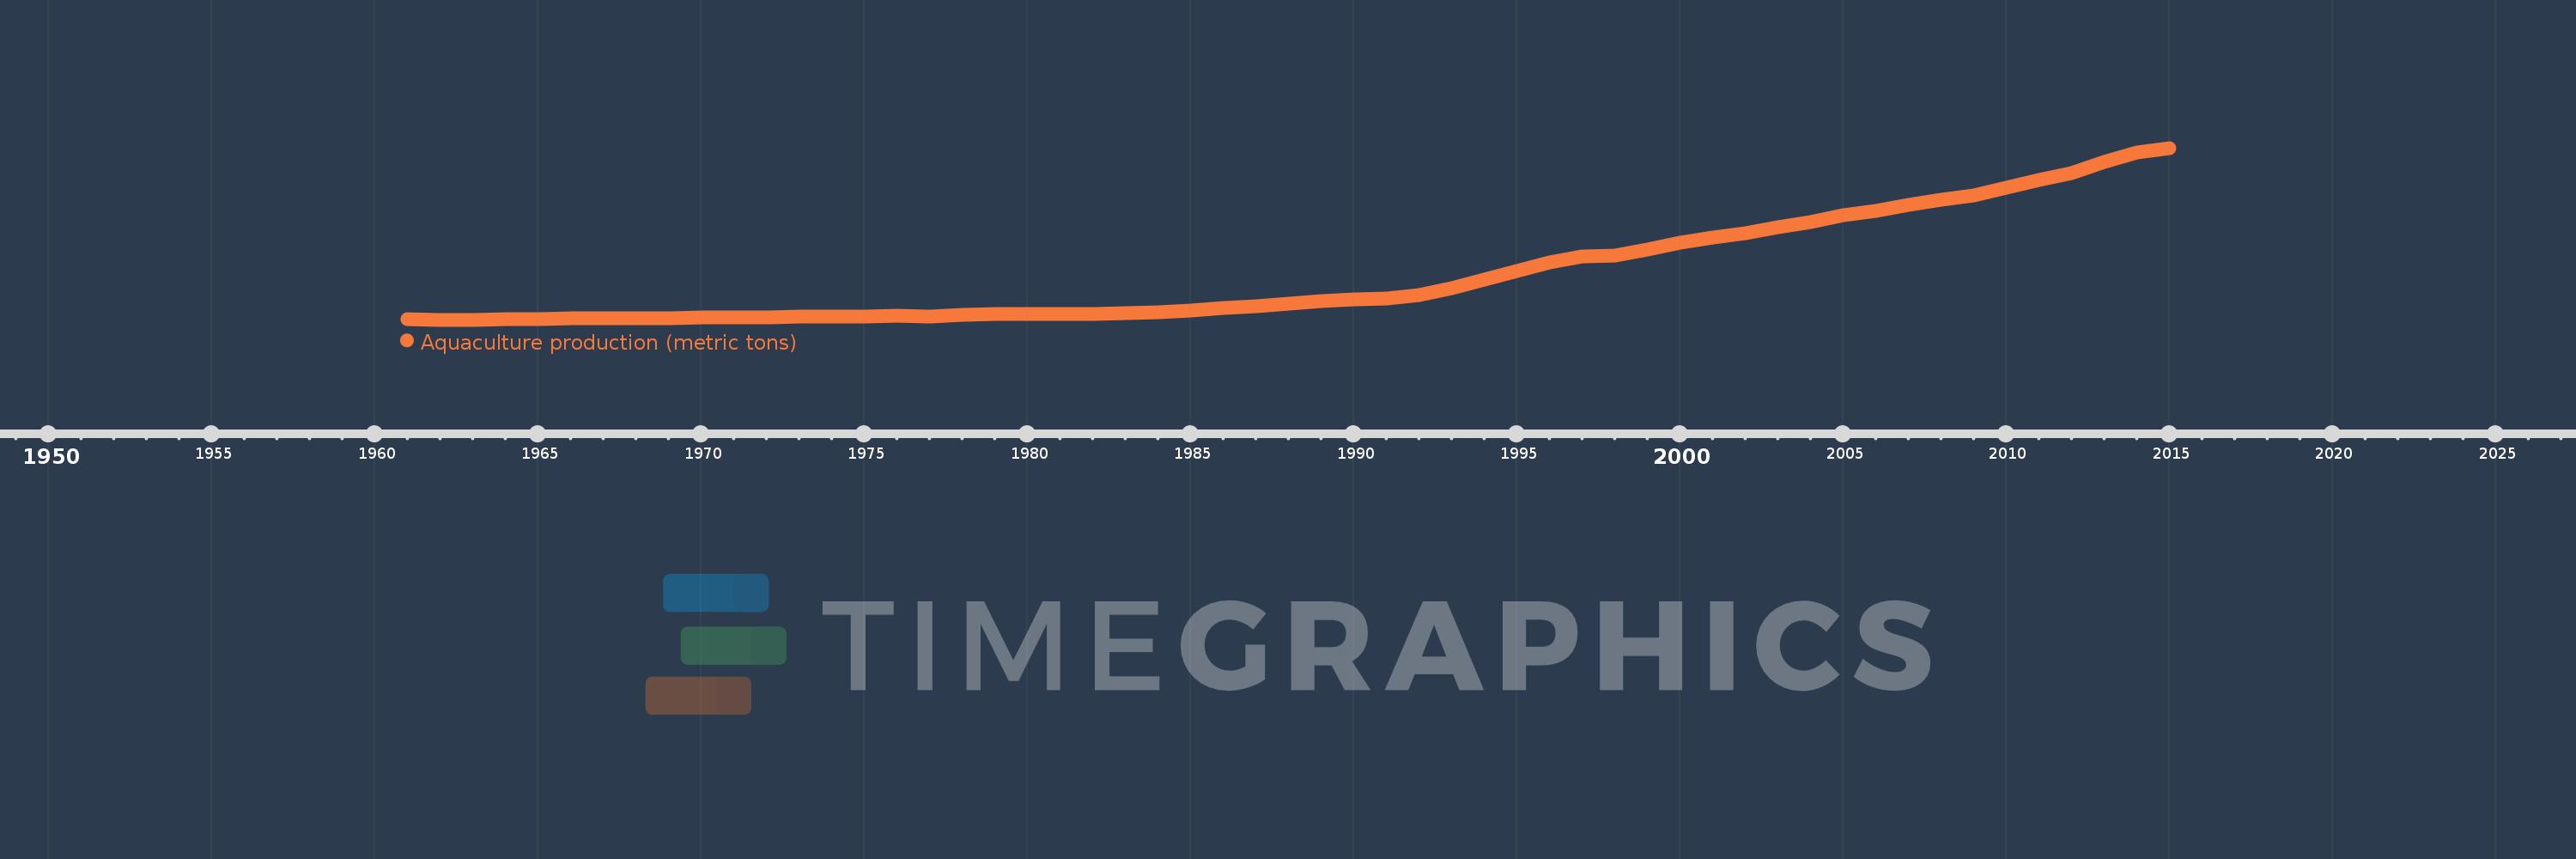
Aquaculture production (metric tons)
2015,2014,2013,2012,2011,2010,2009,2008,2007,2006,2005,2004,2003,2002,2001,2000,1999,1998,1997,1996,1995,1994,1993,1992,1991,1990,1989,1988,1987,1986,1985,1984,1983,1982,1981,1980,1979,1978,1977,1976,1975,1974,1973,1972,1971,1970,1969,1968,1967,1966,1965,1964,1963,1962,1961
This statistics in other country:
AfghanistanAlbaniaAlgeriaAmerican SamoaAngolaArab WorldArgentinaArmeniaArubaAustraliaAustriaAzerbaijanBahamas, TheBahrainBangladeshBarbadosBelarusBelgiumBelizeBeninBhutanBoliviaBosnia and HerzegovinaBrazilBrunei DarussalamBulgariaBurkina FasoBurundiCambodiaCameroonCanadaCaribbean small statesCentral African RepublicCentral Europe and the BalticsChadChannel IslandsChileChinaColombiaCongo, Dem. Rep.Congo, Rep.Costa RicaCote d'IvoireCroatiaCubaCyprusCzech RepublicDenmarkDominicaDominican RepublicEarly-demographic dividendEast Asia & PacificEast Asia & Pacific (excluding high income)East Asia & Pacific (IDA & IBRD countries)EcuadorEgypt, Arab Rep.El SalvadorEquatorial GuineaEritreaEstoniaEthiopiaEuro areaEurope & Central AsiaEurope & Central Asia (excluding high income)Europe & Central Asia (IDA & IBRD countries)European UnionFaroe IslandsFijiFinlandFragile and conflict affected situationsFranceFrench PolynesiaGabonGambia, TheGeorgiaGermanyGhanaGreeceGrenadaGuamGuatemalaGuineaGuyanaHaitiHeavily indebted poor countries (HIPC)High incomeHondurasHong Kong SAR, ChinaHungaryIBRD onlyIcelandIDA & IBRD totalIDA blendIDA onlyIDA totalIndiaIndonesiaIran, Islamic Rep.IraqIrelandIsraelItalyJamaicaJapanJordanKazakhstanKenyaKiribatiKorea, Dem. People’s Rep.Korea, Rep.KuwaitKyrgyz RepublicLao PDRLate-demographic dividendLatin America & Caribbean Latin America & Caribbean (excluding high income)Latin America & the Caribbean (IDA & IBRD countries)LatviaLeast developed countries: UN classificationLebanonLesothoLiberiaLibyaLithuaniaLow & middle incomeLow incomeLower middle incomeMacedonia, FYRMadagascarMalawiMalaysiaMaliMaltaMarshall IslandsMauritiusMexicoMicronesia, Fed. Sts.Middle East & North AfricaMiddle East & North Africa (excluding high income)Middle East & North Africa (IDA & IBRD countries)Middle incomeMoldovaMontenegroMoroccoMozambiqueMyanmarNamibiaNauruNepalNetherlandsNew CaledoniaNew ZealandNicaraguaNigerNigeriaNorth AmericaNorthern Mariana IslandsNorwayOECD membersOmanOther small statesPacific island small statesPakistanPalauPanamaPapua New GuineaParaguayPeruPhilippinesPolandPortugalPost-demographic dividendPre-demographic dividendPuerto RicoQatarRomaniaRussian FederationRwandaSamoaSaudi ArabiaSenegalSerbiaSeychellesSierra LeoneSingaporeSlovak RepublicSloveniaSmall statesSolomon IslandsSouth AfricaSouth AsiaSouth Asia (IDA & IBRD)South SudanSpainSri LankaSt. Kitts and NevisSt. LuciaSub-Saharan Africa Sub-Saharan Africa (excluding high income)Sub-Saharan Africa (IDA & IBRD countries)SudanSurinameSwazilandSwedenSwitzerlandSyrian Arab RepublicTajikistanTanzaniaThailandTimor-LesteTogoTongaTrinidad and TobagoTunisiaTurkeyTurkmenistanTurks and Caicos IslandsTuvaluUgandaUkraineUnited Arab EmiratesUnited KingdomUnited StatesUpper middle incomeUruguayUzbekistanVanuatuVenezuela, RBVietnamVirgin Islands (U.S.)West Bank and GazaWorldYemen, Rep.ZambiaZimbabwe Timeline:
This timeline shows a graph from 1961 to 2015 of China. No data until 1960. Number of actual observations by date: 55.
Source name:
World Development Indicators
Source organization:
Food and Agriculture Organization.
Categories, topics:
Environment
Last updated:
apr 23, 2017
Indicators value changes by year
Minimum:
653.121K
jan 1, 1963
Maximum:
58.797 mln
jan 1, 2015
At the date of observation
Value
Absolute change
Change from previous value
jan 1, 1961
870.506K
+870.506K
0.0%
jan 1, 1962
689.762K
-180.744K
-20.76%
jan 1, 1963
653.121K
-36.641K
-5.31%
jan 1, 1964
751.331K
+98.21K
15.04%
jan 1, 1965
876.283K
+124.952K
16.63%
jan 1, 1966
1.019 mln
+142.457K
16.26%
jan 1, 1967
1.145 mln
+126.035K
12.37%
jan 1, 1968
1.14 mln
-4.864K
-0.42%
jan 1, 1969
1.13 mln
-9.703K
-0.85%
jan 1, 1970
1.303 mln
+172.441K
15.26%
jan 1, 1971
1.294 mln
-8.469K
-0.65%
jan 1, 1972
1.555 mln
+261.018K
20.17%
jan 1, 1973
1.708 mln
+153.031K
9.84%
jan 1, 1974
1.588 mln
-120.245K
-7.04%
jan 1, 1975
1.721 mln
+132.954K
8.37%
jan 1, 1976
1.876 mln
+155.293K
9.02%
jan 1, 1977
1.841 mln
-34.856K
-1.86%
jan 1, 1978
2.397 mln
+555.578K
30.17%
jan 1, 1979
2.545 mln
+147.896K
6.17%
jan 1, 1980
2.479 mln
-65.864K
-2.59%
jan 1, 1981
2.66 mln
+181.241K
7.31%
jan 1, 1982
2.647 mln
-12.803K
-0.48%
jan 1, 1983
2.873 mln
+225.219K
8.51%
jan 1, 1984
3.25 mln
+377.766K
13.15%
jan 1, 1985
3.83 mln
+579.669K
17.83%
jan 1, 1986
4.579 mln
+749.182K
19.56%
jan 1, 1987
5.248 mln
+668.919K
14.61%
jan 1, 1988
6.011 mln
+762.925K
14.54%
jan 1, 1989
6.995 mln
+984.306K
16.37%
jan 1, 1990
7.618 mln
+622.153K
8.89%
jan 1, 1991
7.953 mln
+335.07K
4.4%
jan 1, 1992
9.067 mln
+1.115 mln
14.02%
jan 1, 1993
11.315 mln
+2.248 mln
24.79%
jan 1, 1994
14.162 mln
+2.847 mln
25.16%
jan 1, 1995
17.098 mln
+2.935 mln
20.73%
jan 1, 1996
20.018 mln
+2.92 mln
17.08%
jan 1, 1997
22.157 mln
+2.138 mln
10.68%
jan 1, 1998
22.45 mln
+293.332K
1.32%
jan 1, 1999
24.408 mln
+1.958 mln
8.72%
jan 1, 2000
26.599 mln
+2.191 mln
8.98%
jan 1, 2001
28.46 mln
+1.861 mln
7.0%
jan 1, 2002
29.869 mln
+1.409 mln
4.95%
jan 1, 2003
31.862 mln
+1.993 mln
6.67%
jan 1, 2004
33.63 mln
+1.768 mln
5.55%
jan 1, 2005
35.939 mln
+2.309 mln
6.86%
jan 1, 2006
37.615 mln
+1.676 mln
4.66%
jan 1, 2007
39.57 mln
+1.955 mln
5.2%
jan 1, 2008
41.165 mln
+1.595 mln
4.03%
jan 1, 2009
42.669 mln
+1.504 mln
3.65%
jan 1, 2010
45.279 mln
+2.61 mln
6.12%
jan 1, 2011
47.83 mln
+2.55 mln
5.63%
jan 1, 2012
50.173 mln
+2.344 mln
4.9%
jan 1, 2013
53.943 mln
+3.77 mln
7.51%
jan 1, 2014
57.113 mln
+3.17 mln
5.88%
jan 1, 2015
58.797 mln
+1.684 mln
2.95%
Ranking of countries by current statistics by years


Comments: