29
/
en
AIzaSyAYiBZKx7MnpbEhh9jyipgxe19OcubqV5w
April 1, 2024
27869
East Asia & Pacific (excluding high income)
EAP
false
2
1
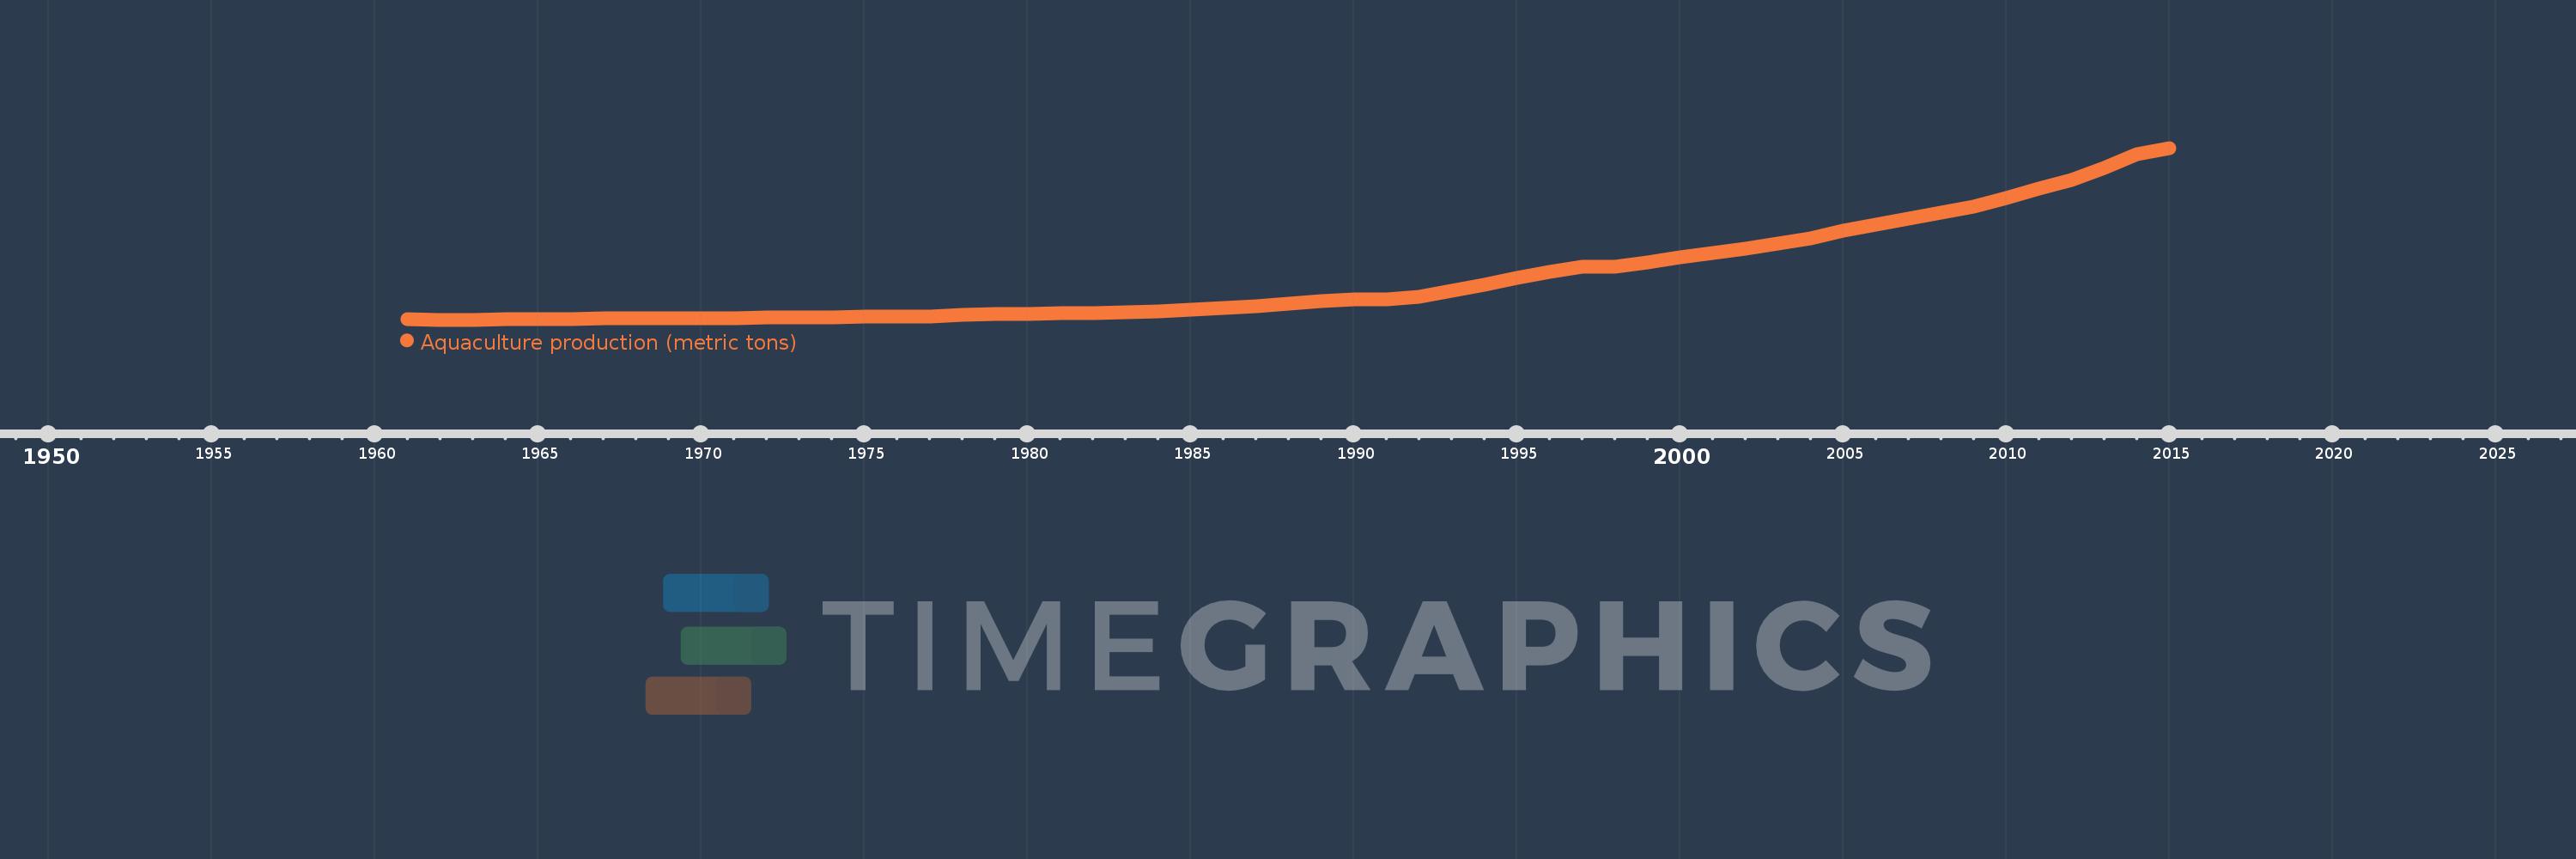
Aquaculture production (metric tons)
2015,2014,2013,2012,2011,2010,2009,2008,2007,2006,2005,2004,2003,2002,2001,2000,1999,1998,1997,1996,1995,1994,1993,1992,1991,1990,1989,1988,1987,1986,1985,1984,1983,1982,1981,1980,1979,1978,1977,1976,1975,1974,1973,1972,1971,1970,1969,1968,1967,1966,1965,1964,1963,1962,1961
This statistics in other country:
AfghanistanAlbaniaAlgeriaAmerican SamoaAngolaArab WorldArgentinaArmeniaArubaAustraliaAustriaAzerbaijanBahamas, TheBahrainBangladeshBarbadosBelarusBelgiumBelizeBeninBhutanBoliviaBosnia and HerzegovinaBrazilBrunei DarussalamBulgariaBurkina FasoBurundiCambodiaCameroonCanadaCaribbean small statesCentral African RepublicCentral Europe and the BalticsChadChannel IslandsChileChinaColombiaCongo, Dem. Rep.Congo, Rep.Costa RicaCote d'IvoireCroatiaCubaCyprusCzech RepublicDenmarkDominicaDominican RepublicEarly-demographic dividendEast Asia & PacificEast Asia & Pacific (excluding high income)East Asia & Pacific (IDA & IBRD countries)EcuadorEgypt, Arab Rep.El SalvadorEquatorial GuineaEritreaEstoniaEthiopiaEuro areaEurope & Central AsiaEurope & Central Asia (excluding high income)Europe & Central Asia (IDA & IBRD countries)European UnionFaroe IslandsFijiFinlandFragile and conflict affected situationsFranceFrench PolynesiaGabonGambia, TheGeorgiaGermanyGhanaGreeceGrenadaGuamGuatemalaGuineaGuyanaHaitiHeavily indebted poor countries (HIPC)High incomeHondurasHong Kong SAR, ChinaHungaryIBRD onlyIcelandIDA & IBRD totalIDA blendIDA onlyIDA totalIndiaIndonesiaIran, Islamic Rep.IraqIrelandIsraelItalyJamaicaJapanJordanKazakhstanKenyaKiribatiKorea, Dem. People’s Rep.Korea, Rep.KuwaitKyrgyz RepublicLao PDRLate-demographic dividendLatin America & Caribbean Latin America & Caribbean (excluding high income)Latin America & the Caribbean (IDA & IBRD countries)LatviaLeast developed countries: UN classificationLebanonLesothoLiberiaLibyaLithuaniaLow & middle incomeLow incomeLower middle incomeMacedonia, FYRMadagascarMalawiMalaysiaMaliMaltaMarshall IslandsMauritiusMexicoMicronesia, Fed. Sts.Middle East & North AfricaMiddle East & North Africa (excluding high income)Middle East & North Africa (IDA & IBRD countries)Middle incomeMoldovaMontenegroMoroccoMozambiqueMyanmarNamibiaNauruNepalNetherlandsNew CaledoniaNew ZealandNicaraguaNigerNigeriaNorth AmericaNorthern Mariana IslandsNorwayOECD membersOmanOther small statesPacific island small statesPakistanPalauPanamaPapua New GuineaParaguayPeruPhilippinesPolandPortugalPost-demographic dividendPre-demographic dividendPuerto RicoQatarRomaniaRussian FederationRwandaSamoaSaudi ArabiaSenegalSerbiaSeychellesSierra LeoneSingaporeSlovak RepublicSloveniaSmall statesSolomon IslandsSouth AfricaSouth AsiaSouth Asia (IDA & IBRD)South SudanSpainSri LankaSt. Kitts and NevisSt. LuciaSub-Saharan Africa Sub-Saharan Africa (excluding high income)Sub-Saharan Africa (IDA & IBRD countries)SudanSurinameSwazilandSwedenSwitzerlandSyrian Arab RepublicTajikistanTanzaniaThailandTimor-LesteTogoTongaTrinidad and TobagoTunisiaTurkeyTurkmenistanTurks and Caicos IslandsTuvaluUgandaUkraineUnited Arab EmiratesUnited KingdomUnited StatesUpper middle incomeUruguayUzbekistanVanuatuVenezuela, RBVietnamVirgin Islands (U.S.)West Bank and GazaWorldYemen, Rep.ZambiaZimbabwe Timeline:
This timeline shows a graph from 1961 to 2015 of East Asia & Pacific (excluding high income). No data until 1960. Number of actual observations by date: 55.
Source name:
World Development Indicators
Source organization:
Food and Agriculture Organization.
Categories, topics:
Environment
Last updated:
apr 23, 2017
Indicators value changes by year
Minimum:
907.295K
jan 1, 1963
Maximum:
82.108 mln
jan 1, 2015
At the date of observation
Value
Absolute change
Change from previous value
jan 1, 1961
1.094 mln
+1.094 mln
0.0%
jan 1, 1962
933.573K
-160.703K
-14.69%
jan 1, 1963
907.295K
-26.278K
-2.81%
jan 1, 1964
1.019 mln
+111.971K
12.34%
jan 1, 1965
1.155 mln
+136.03K
13.35%
jan 1, 1966
1.308 mln
+152.37K
13.19%
jan 1, 1967
1.466 mln
+158.649K
12.13%
jan 1, 1968
1.485 mln
+18.599K
1.27%
jan 1, 1969
1.528 mln
+42.999K
2.9%
jan 1, 1970
1.73 mln
+201.901K
13.21%
jan 1, 1971
1.758 mln
+27.878K
1.61%
jan 1, 1972
2.053 mln
+295.566K
16.82%
jan 1, 1973
2.198 mln
+144.438K
7.03%
jan 1, 1974
2.113 mln
-84.255K
-3.83%
jan 1, 1975
2.319 mln
+205.764K
9.74%
jan 1, 1976
2.52 mln
+201.051K
8.67%
jan 1, 1977
2.58 mln
+60.0K
2.38%
jan 1, 1978
3.247 mln
+666.719K
25.84%
jan 1, 1979
3.499 mln
+252.345K
7.77%
jan 1, 1980
3.524 mln
+24.303K
0.69%
jan 1, 1981
3.89 mln
+366.604K
10.4%
jan 1, 1982
3.985 mln
+94.8K
2.44%
jan 1, 1983
4.283 mln
+297.804K
7.47%
jan 1, 1984
4.844 mln
+560.799K
13.09%
jan 1, 1985
5.641 mln
+797.173K
16.46%
jan 1, 1986
6.509 mln
+868.292K
15.39%
jan 1, 1987
7.323 mln
+813.473K
12.5%
jan 1, 1988
8.474 mln
+1.151 mln
15.72%
jan 1, 1989
9.627 mln
+1.153 mln
13.61%
jan 1, 1990
10.481 mln
+854.169K
8.87%
jan 1, 1991
10.665 mln
+183.946K
1.75%
jan 1, 1992
11.941 mln
+1.276 mln
11.96%
jan 1, 1993
14.472 mln
+2.531 mln
21.19%
jan 1, 1994
17.621 mln
+3.149 mln
21.76%
jan 1, 1995
20.543 mln
+2.922 mln
16.58%
jan 1, 1996
23.621 mln
+3.078 mln
14.98%
jan 1, 1997
25.908 mln
+2.287 mln
9.68%
jan 1, 1998
25.805 mln
-103.341K
-0.4%
jan 1, 1999
27.842 mln
+2.037 mln
7.89%
jan 1, 2000
30.449 mln
+2.608 mln
9.37%
jan 1, 2001
32.616 mln
+2.167 mln
7.12%
jan 1, 2002
34.472 mln
+1.856 mln
5.69%
jan 1, 2003
36.976 mln
+2.504 mln
7.26%
jan 1, 2004
39.373 mln
+2.396 mln
6.48%
jan 1, 2005
42.818 mln
+3.445 mln
8.75%
jan 1, 2006
45.714 mln
+2.896 mln
6.76%
jan 1, 2007
48.594 mln
+2.88 mln
6.3%
jan 1, 2008
51.473 mln
+2.879 mln
5.92%
jan 1, 2009
54.388 mln
+2.915 mln
5.66%
jan 1, 2010
58.353 mln
+3.965 mln
7.29%
jan 1, 2011
62.73 mln
+4.377 mln
7.5%
jan 1, 2012
66.818 mln
+4.088 mln
6.52%
jan 1, 2013
72.695 mln
+5.877 mln
8.8%
jan 1, 2014
79.199 mln
+6.505 mln
8.95%
jan 1, 2015
82.108 mln
+2.908 mln
3.67%
Ranking of countries by current statistics by years


Comments: