29
/
en
AIzaSyAYiBZKx7MnpbEhh9jyipgxe19OcubqV5w
April 1, 2024
30475
Europe & Central Asia
ECS
false
2
1
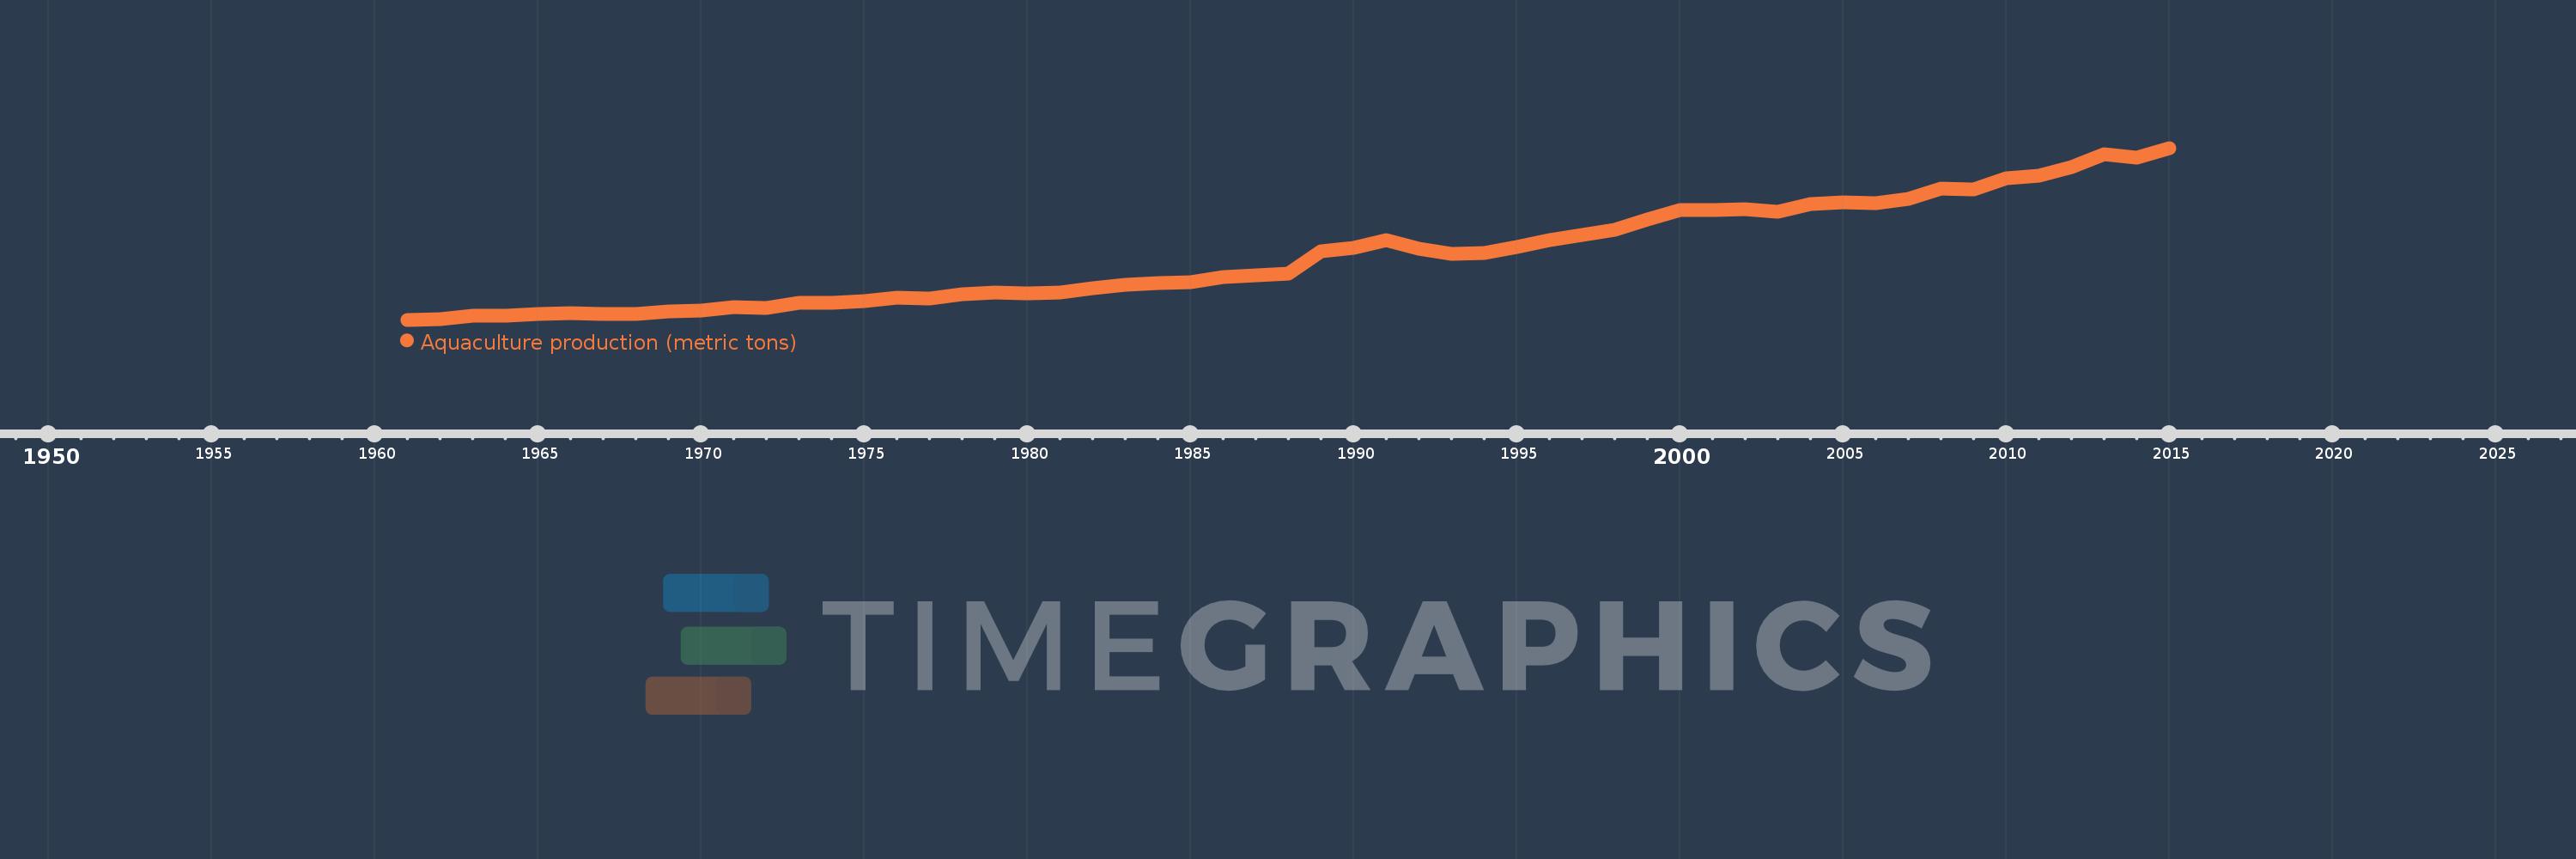
Aquaculture production (metric tons)
2015,2014,2013,2012,2011,2010,2009,2008,2007,2006,2005,2004,2003,2002,2001,2000,1999,1998,1997,1996,1995,1994,1993,1992,1991,1990,1989,1988,1987,1986,1985,1984,1983,1982,1981,1980,1979,1978,1977,1976,1975,1974,1973,1972,1971,1970,1969,1968,1967,1966,1965,1964,1963,1962,1961
This statistics in other country:
AfghanistanAlbaniaAlgeriaAmerican SamoaAngolaArab WorldArgentinaArmeniaArubaAustraliaAustriaAzerbaijanBahamas, TheBahrainBangladeshBarbadosBelarusBelgiumBelizeBeninBhutanBoliviaBosnia and HerzegovinaBrazilBrunei DarussalamBulgariaBurkina FasoBurundiCambodiaCameroonCanadaCaribbean small statesCentral African RepublicCentral Europe and the BalticsChadChannel IslandsChileChinaColombiaCongo, Dem. Rep.Congo, Rep.Costa RicaCote d'IvoireCroatiaCubaCyprusCzech RepublicDenmarkDominicaDominican RepublicEarly-demographic dividendEast Asia & PacificEast Asia & Pacific (excluding high income)East Asia & Pacific (IDA & IBRD countries)EcuadorEgypt, Arab Rep.El SalvadorEquatorial GuineaEritreaEstoniaEthiopiaEuro areaEurope & Central AsiaEurope & Central Asia (excluding high income)Europe & Central Asia (IDA & IBRD countries)European UnionFaroe IslandsFijiFinlandFragile and conflict affected situationsFranceFrench PolynesiaGabonGambia, TheGeorgiaGermanyGhanaGreeceGrenadaGuamGuatemalaGuineaGuyanaHaitiHeavily indebted poor countries (HIPC)High incomeHondurasHong Kong SAR, ChinaHungaryIBRD onlyIcelandIDA & IBRD totalIDA blendIDA onlyIDA totalIndiaIndonesiaIran, Islamic Rep.IraqIrelandIsraelItalyJamaicaJapanJordanKazakhstanKenyaKiribatiKorea, Dem. People’s Rep.Korea, Rep.KuwaitKyrgyz RepublicLao PDRLate-demographic dividendLatin America & Caribbean Latin America & Caribbean (excluding high income)Latin America & the Caribbean (IDA & IBRD countries)LatviaLeast developed countries: UN classificationLebanonLesothoLiberiaLibyaLithuaniaLow & middle incomeLow incomeLower middle incomeMacedonia, FYRMadagascarMalawiMalaysiaMaliMaltaMarshall IslandsMauritiusMexicoMicronesia, Fed. Sts.Middle East & North AfricaMiddle East & North Africa (excluding high income)Middle East & North Africa (IDA & IBRD countries)Middle incomeMoldovaMontenegroMoroccoMozambiqueMyanmarNamibiaNauruNepalNetherlandsNew CaledoniaNew ZealandNicaraguaNigerNigeriaNorth AmericaNorthern Mariana IslandsNorwayOECD membersOmanOther small statesPacific island small statesPakistanPalauPanamaPapua New GuineaParaguayPeruPhilippinesPolandPortugalPost-demographic dividendPre-demographic dividendPuerto RicoQatarRomaniaRussian FederationRwandaSamoaSaudi ArabiaSenegalSerbiaSeychellesSierra LeoneSingaporeSlovak RepublicSloveniaSmall statesSolomon IslandsSouth AfricaSouth AsiaSouth Asia (IDA & IBRD)South SudanSpainSri LankaSt. Kitts and NevisSt. LuciaSub-Saharan Africa Sub-Saharan Africa (excluding high income)Sub-Saharan Africa (IDA & IBRD countries)SudanSurinameSwazilandSwedenSwitzerlandSyrian Arab RepublicTajikistanTanzaniaThailandTimor-LesteTogoTongaTrinidad and TobagoTunisiaTurkeyTurkmenistanTurks and Caicos IslandsTuvaluUgandaUkraineUnited Arab EmiratesUnited KingdomUnited StatesUpper middle incomeUruguayUzbekistanVanuatuVenezuela, RBVietnamVirgin Islands (U.S.)West Bank and GazaWorldYemen, Rep.ZambiaZimbabwe Timeline:
This timeline shows a graph from 1961 to 2015 of Europe & Central Asia. No data until 1960. Number of actual observations by date: 55.
Source name:
World Development Indicators
Source organization:
Food and Agriculture Organization.
Categories, topics:
Environment
Last updated:
apr 23, 2017
Indicators value changes by year
Minimum:
261.934K
jan 1, 1961
Maximum:
3.208 mln
jan 1, 2015
At the date of observation
Value
Absolute change
Change from previous value
jan 1, 1961
261.934K
+261.934K
0.0%
jan 1, 1962
279.06K
+17.126K
6.54%
jan 1, 1963
325.424K
+46.364K
16.61%
jan 1, 1964
333.898K
+8.474K
2.6%
jan 1, 1965
359.826K
+25.928K
7.77%
jan 1, 1966
375.837K
+16.011K
4.45%
jan 1, 1967
355.332K
-20.505K
-5.46%
jan 1, 1968
359.314K
+3.982K
1.12%
jan 1, 1969
405.595K
+46.281K
12.88%
jan 1, 1970
421.634K
+16.039K
3.95%
jan 1, 1971
472.162K
+50.528K
11.98%
jan 1, 1972
462.284K
-9.878K
-2.09%
jan 1, 1973
559.283K
+96.999K
20.98%
jan 1, 1974
556.672K
-2.611K
-0.47%
jan 1, 1975
586.59K
+29.918K
5.37%
jan 1, 1976
639.914K
+53.324K
9.09%
jan 1, 1977
620.374K
-19.54K
-3.05%
jan 1, 1978
693.358K
+72.984K
11.76%
jan 1, 1979
732.189K
+38.831K
5.6%
jan 1, 1980
707.372K
-24.817K
-3.39%
jan 1, 1981
730.339K
+22.967K
3.25%
jan 1, 1982
797.569K
+67.23K
9.21%
jan 1, 1983
862.011K
+64.442K
8.08%
jan 1, 1984
887.447K
+25.436K
2.95%
jan 1, 1985
903.543K
+16.096K
1.81%
jan 1, 1986
990.333K
+86.79K
9.61%
jan 1, 1987
1.023 mln
+32.504K
3.28%
jan 1, 1988
1.05 mln
+26.901K
2.63%
jan 1, 1989
1.439 mln
+388.948K
37.05%
jan 1, 1990
1.495 mln
+56.47K
3.93%
jan 1, 1991
1.628 mln
+132.637K
8.87%
jan 1, 1992
1.482 mln
-145.797K
-8.96%
jan 1, 1993
1.393 mln
-89.106K
-6.01%
jan 1, 1994
1.403 mln
+10.316K
0.74%
jan 1, 1995
1.516 mln
+112.721K
8.03%
jan 1, 1996
1.627 mln
+111.489K
7.35%
jan 1, 1997
1.711 mln
+84.038K
5.16%
jan 1, 1998
1.804 mln
+92.355K
5.4%
jan 1, 1999
1.984 mln
+180.523K
10.01%
jan 1, 2000
2.141 mln
+156.978K
7.91%
jan 1, 2001
2.14 mln
-1.336K
-0.06%
jan 1, 2002
2.163 mln
+23.126K
1.08%
jan 1, 2003
2.108 mln
-55.091K
-2.55%
jan 1, 2004
2.245 mln
+136.602K
6.48%
jan 1, 2005
2.269 mln
+24.815K
1.11%
jan 1, 2006
2.257 mln
-12.213K
-0.54%
jan 1, 2007
2.33 mln
+72.399K
3.21%
jan 1, 2008
2.517 mln
+187.056K
8.03%
jan 1, 2009
2.492 mln
-24.68K
-0.98%
jan 1, 2010
2.692 mln
+199.682K
8.01%
jan 1, 2011
2.729 mln
+37.383K
1.39%
jan 1, 2012
2.872 mln
+143.316K
5.25%
jan 1, 2013
3.094 mln
+221.433K
7.71%
jan 1, 2014
3.038 mln
-55.42K
-1.79%
jan 1, 2015
3.208 mln
+169.346K
5.57%
Ranking of countries by current statistics by years


Comments: