29
/
en
AIzaSyAYiBZKx7MnpbEhh9jyipgxe19OcubqV5w
April 1, 2024
169648
Korea, Rep.
KOR
true
2
1
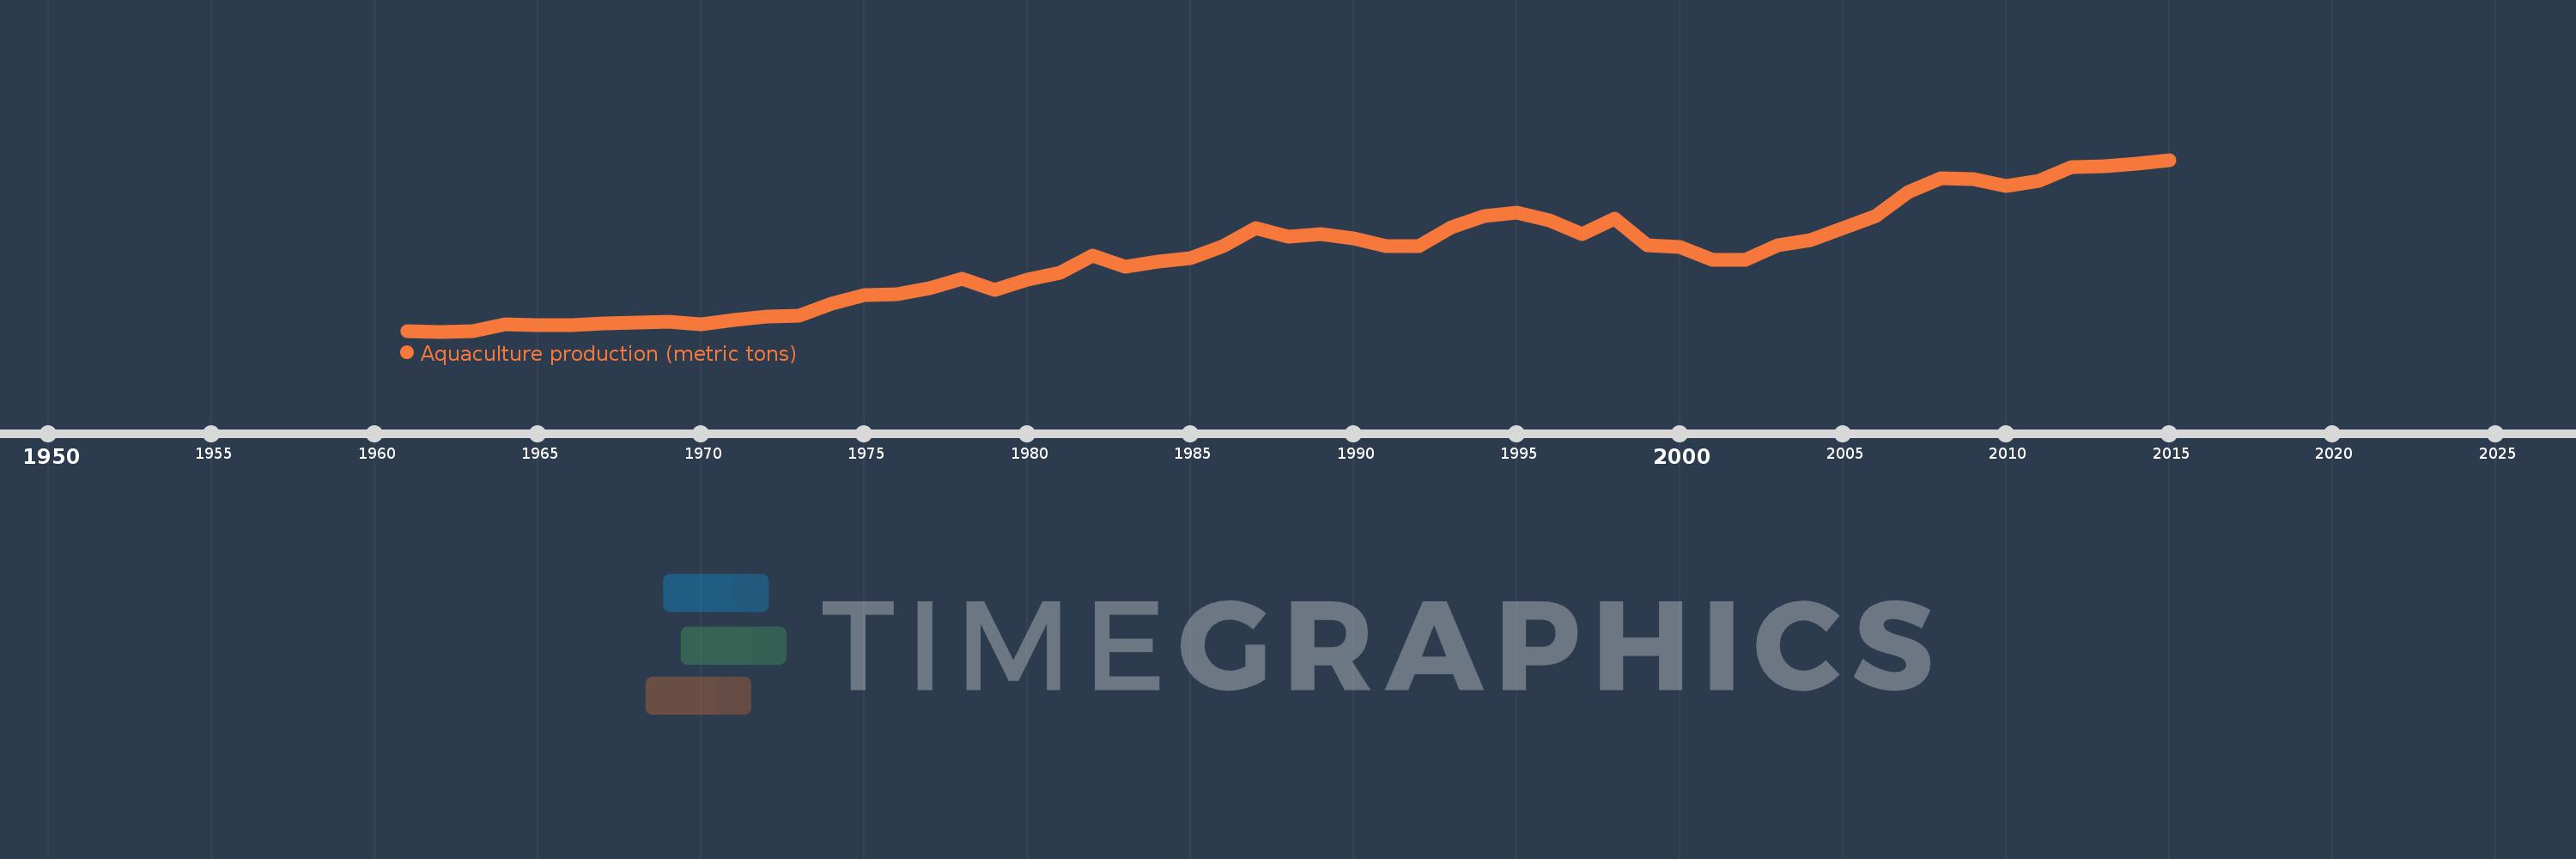
Aquaculture production (metric tons)
2015,2014,2013,2012,2011,2010,2009,2008,2007,2006,2005,2004,2003,2002,2001,2000,1999,1998,1997,1996,1995,1994,1993,1992,1991,1990,1989,1988,1987,1986,1985,1984,1983,1982,1981,1980,1979,1978,1977,1976,1975,1974,1973,1972,1971,1970,1969,1968,1967,1966,1965,1964,1963,1962,1961
This statistics in other country:
AfghanistanAlbaniaAlgeriaAmerican SamoaAngolaArab WorldArgentinaArmeniaArubaAustraliaAustriaAzerbaijanBahamas, TheBahrainBangladeshBarbadosBelarusBelgiumBelizeBeninBhutanBoliviaBosnia and HerzegovinaBrazilBrunei DarussalamBulgariaBurkina FasoBurundiCambodiaCameroonCanadaCaribbean small statesCentral African RepublicCentral Europe and the BalticsChadChannel IslandsChileChinaColombiaCongo, Dem. Rep.Congo, Rep.Costa RicaCote d'IvoireCroatiaCubaCyprusCzech RepublicDenmarkDominicaDominican RepublicEarly-demographic dividendEast Asia & PacificEast Asia & Pacific (excluding high income)East Asia & Pacific (IDA & IBRD countries)EcuadorEgypt, Arab Rep.El SalvadorEquatorial GuineaEritreaEstoniaEthiopiaEuro areaEurope & Central AsiaEurope & Central Asia (excluding high income)Europe & Central Asia (IDA & IBRD countries)European UnionFaroe IslandsFijiFinlandFragile and conflict affected situationsFranceFrench PolynesiaGabonGambia, TheGeorgiaGermanyGhanaGreeceGrenadaGuamGuatemalaGuineaGuyanaHaitiHeavily indebted poor countries (HIPC)High incomeHondurasHong Kong SAR, ChinaHungaryIBRD onlyIcelandIDA & IBRD totalIDA blendIDA onlyIDA totalIndiaIndonesiaIran, Islamic Rep.IraqIrelandIsraelItalyJamaicaJapanJordanKazakhstanKenyaKiribatiKorea, Dem. People’s Rep.Korea, Rep.KuwaitKyrgyz RepublicLao PDRLate-demographic dividendLatin America & Caribbean Latin America & Caribbean (excluding high income)Latin America & the Caribbean (IDA & IBRD countries)LatviaLeast developed countries: UN classificationLebanonLesothoLiberiaLibyaLithuaniaLow & middle incomeLow incomeLower middle incomeMacedonia, FYRMadagascarMalawiMalaysiaMaliMaltaMarshall IslandsMauritiusMexicoMicronesia, Fed. Sts.Middle East & North AfricaMiddle East & North Africa (excluding high income)Middle East & North Africa (IDA & IBRD countries)Middle incomeMoldovaMontenegroMoroccoMozambiqueMyanmarNamibiaNauruNepalNetherlandsNew CaledoniaNew ZealandNicaraguaNigerNigeriaNorth AmericaNorthern Mariana IslandsNorwayOECD membersOmanOther small statesPacific island small statesPakistanPalauPanamaPapua New GuineaParaguayPeruPhilippinesPolandPortugalPost-demographic dividendPre-demographic dividendPuerto RicoQatarRomaniaRussian FederationRwandaSamoaSaudi ArabiaSenegalSerbiaSeychellesSierra LeoneSingaporeSlovak RepublicSloveniaSmall statesSolomon IslandsSouth AfricaSouth AsiaSouth Asia (IDA & IBRD)South SudanSpainSri LankaSt. Kitts and NevisSt. LuciaSub-Saharan Africa Sub-Saharan Africa (excluding high income)Sub-Saharan Africa (IDA & IBRD countries)SudanSurinameSwazilandSwedenSwitzerlandSyrian Arab RepublicTajikistanTanzaniaThailandTimor-LesteTogoTongaTrinidad and TobagoTunisiaTurkeyTurkmenistanTurks and Caicos IslandsTuvaluUgandaUkraineUnited Arab EmiratesUnited KingdomUnited StatesUpper middle incomeUruguayUzbekistanVanuatuVenezuela, RBVietnamVirgin Islands (U.S.)West Bank and GazaWorldYemen, Rep.ZambiaZimbabwe Timeline:
This timeline shows a graph from 1961 to 2015 of Korea, Rep.. No data until 1960. Number of actual observations by date: 55.
Source name:
World Development Indicators
Source organization:
Food and Agriculture Organization.
Categories, topics:
Environment
Last updated:
apr 23, 2017
Indicators value changes by year
Minimum:
17.404K
jan 1, 1962
Maximum:
1.567 mln
jan 1, 2015
At the date of observation
Value
Absolute change
Change from previous value
jan 1, 1961
18.637K
+18.637K
0.0%
jan 1, 1962
17.404K
-1.233K
-6.62%
jan 1, 1963
23.901K
+6.497K
37.33%
jan 1, 1964
80.479K
+56.578K
236.72%
jan 1, 1965
72.557K
-7.922K
-9.84%
jan 1, 1966
73.35K
+793.0
1.09%
jan 1, 1967
91.626K
+18.276K
24.92%
jan 1, 1968
96.45K
+4.824K
5.26%
jan 1, 1969
105.769K
+9.319K
9.66%
jan 1, 1970
80.605K
-25.164K
-23.79%
jan 1, 1971
124.058K
+43.453K
53.91%
jan 1, 1972
151.885K
+27.827K
22.43%
jan 1, 1973
163.955K
+12.07K
7.95%
jan 1, 1974
265.546K
+101.591K
61.96%
jan 1, 1975
343.865K
+78.319K
29.49%
jan 1, 1976
352.495K
+8.63K
2.51%
jan 1, 1977
412.663K
+60.168K
17.07%
jan 1, 1978
493.461K
+80.798K
19.58%
jan 1, 1979
395.177K
-98.284K
-19.92%
jan 1, 1980
484.844K
+89.667K
22.69%
jan 1, 1981
545.133K
+60.289K
12.43%
jan 1, 1982
704.89K
+159.757K
29.31%
jan 1, 1983
603.311K
-101.579K
-14.41%
jan 1, 1984
645.426K
+42.115K
6.98%
jan 1, 1985
679.342K
+33.916K
5.25%
jan 1, 1986
790.769K
+111.427K
16.4%
jan 1, 1987
952.388K
+161.619K
20.44%
jan 1, 1988
875.568K
-76.82K
-8.07%
jan 1, 1989
898.649K
+23.081K
2.64%
jan 1, 1990
858.573K
-40.076K
-4.46%
jan 1, 1991
788.565K
-70.008K
-8.15%
jan 1, 1992
787.977K
-588.0
-0.07%
jan 1, 1993
955.477K
+167.5K
21.26%
jan 1, 1994
1.057 mln
+101.026K
10.57%
jan 1, 1995
1.093 mln
+36.485K
3.45%
jan 1, 1996
1.017 mln
-75.734K
-6.93%
jan 1, 1997
897.041K
-120.213K
-11.82%
jan 1, 1998
1.04 mln
+143.169K
15.96%
jan 1, 1999
796.632K
-243.578K
-23.42%
jan 1, 2000
777.711K
-18.921K
-2.38%
jan 1, 2001
667.883K
-109.828K
-14.12%
jan 1, 2002
668.022K
+139.0
0.02%
jan 1, 2003
794.34K
+126.318K
18.91%
jan 1, 2004
839.845K
+45.505K
5.73%
jan 1, 2005
952.856K
+113.011K
13.46%
jan 1, 2006
1.058 mln
+104.869K
11.01%
jan 1, 2007
1.279 mln
+221.438K
20.94%
jan 1, 2008
1.399 mln
+119.912K
9.37%
jan 1, 2009
1.395 mln
-4.257K
-0.3%
jan 1, 2010
1.332 mln
-63.099K
-4.52%
jan 1, 2011
1.377 mln
+45.514K
3.42%
jan 1, 2012
1.499 mln
+122.102K
8.87%
jan 1, 2013
1.509 mln
+9.891K
0.66%
jan 1, 2014
1.533 mln
+24.22K
1.6%
jan 1, 2015
1.567 mln
+33.996K
2.22%
Ranking of countries by current statistics by years


Comments: