29
/
en
AIzaSyAYiBZKx7MnpbEhh9jyipgxe19OcubqV5w
April 1, 2024
273662
Ukraine
UKR
true
2
1
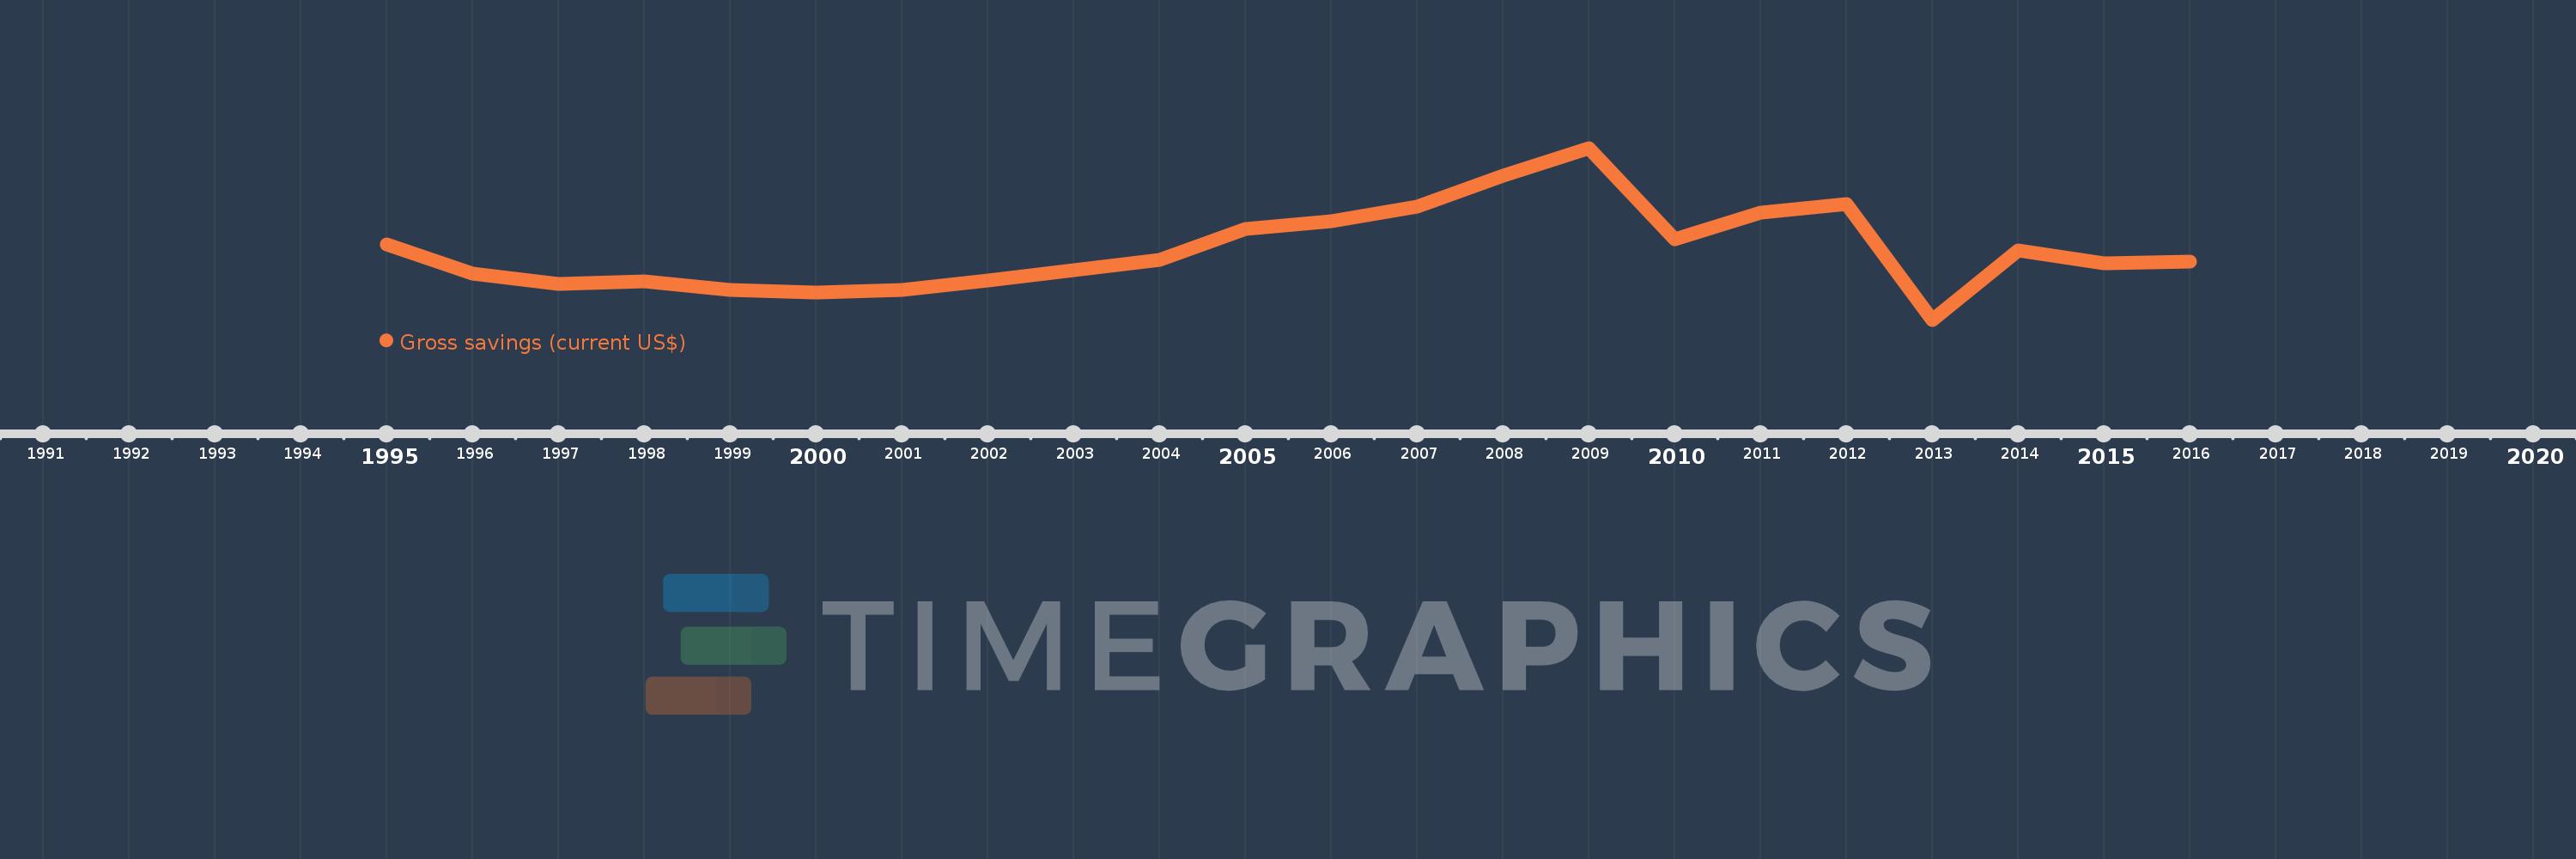
Gross savings (current US$)
2016,2015,2014,2013,2012,2011,2010,2009,2008,2007,2006,2005,2004,2003,2002,2001,2000,1999,1998,1997,1996,1995
This statistics in other country:
AfghanistanAlbaniaAlgeriaAngolaAntigua and BarbudaArgentinaArmeniaAustraliaAustriaAzerbaijanBahamas, TheBahrainBangladeshBarbadosBelarusBelgiumBelizeBeninBermudaBhutanBoliviaBosnia and HerzegovinaBotswanaBrazilBrunei DarussalamBulgariaBurkina FasoBurundiCabo VerdeCambodiaCameroonCanadaCentral African RepublicChadChileChinaColombiaComorosCongo, Dem. Rep.Congo, Rep.Costa RicaCote d'IvoireCroatiaCyprusCzech RepublicDenmarkDjiboutiDominicaDominican RepublicEcuadorEgypt, Arab Rep.El SalvadorEquatorial GuineaEritreaEstoniaEthiopiaFaroe IslandsFijiFinlandFranceGabonGambia, TheGeorgiaGermanyGhanaGreeceGrenadaGuatemalaGuineaGuinea-BissauGuyanaHaitiHondurasHong Kong SAR, ChinaHungaryIcelandIndiaIndonesiaIran, Islamic Rep.IraqIrelandIsraelItalyJamaicaJapanJordanKazakhstanKenyaKiribatiKorea, Rep.KosovoKuwaitKyrgyz RepublicLao PDRLatviaLebanonLesothoLiberiaLibyaLithuaniaLuxembourgMacao SAR, ChinaMacedonia, FYRMadagascarMalawiMalaysiaMaldivesMaliMaltaMauritaniaMauritiusMexicoMoldovaMongoliaMontenegroMoroccoMozambiqueNamibiaNepalNetherlandsNew ZealandNicaraguaNigerNigeriaNorwayOmanPakistanPanamaPapua New GuineaParaguayPeruPhilippinesPolandPortugalQatarRomaniaRussian FederationRwandaSaudi ArabiaSenegalSerbiaSeychellesSierra LeoneSingaporeSlovak RepublicSloveniaSolomon IslandsSouth AfricaSouth SudanSpainSri LankaSt. Kitts and NevisSt. LuciaSt. Vincent and the GrenadinesSudanSurinameSwazilandSwedenSwitzerlandSyrian Arab RepublicTajikistanTanzaniaThailandTimor-LesteTogoTongaTrinidad and TobagoTunisiaTurkeyUgandaUkraineUnited KingdomUnited StatesUruguayVanuatuVenezuela, RBVietnamWest Bank and GazaYemen, Rep.ZambiaZimbabwe Timeline:
This timeline shows a graph from 1995 to 2016 of Ukraine. No data until 1994. Number of actual observations by date: 22.
Source name:
World Development Indicators
Source organization:
World Bank national accounts data, and OECD National Accounts data files.
Categories, topics:
Economy & Growth
Last updated:
apr 23, 2017
Indicators value changes by year
Minimum:
1.341 bln
jan 1, 2013
Maximum:
37.499 bln
jan 1, 2009
At the date of observation
Value
Absolute change
Change from previous value
jan 1, 1995
17.107 bln
+17.107 bln
0.0%
jan 1, 1996
11.075 bln
-6.032 bln
-35.26%
jan 1, 1997
8.901 bln
-2.174 bln
-19.63%
jan 1, 1998
9.422 bln
+521.197 mln
5.86%
jan 1, 1999
7.704 bln
-1.718 bln
-18.24%
jan 1, 2000
7.091 bln
-613.053 mln
-7.96%
jan 1, 2001
7.616 bln
+524.869 mln
7.4%
jan 1, 2002
9.68 bln
+2.064 bln
27.1%
jan 1, 2003
11.714 bln
+2.034 bln
21.01%
jan 1, 2004
13.905 bln
+2.192 bln
18.71%
jan 1, 2005
20.365 bln
+6.459 bln
46.45%
jan 1, 2006
22.036 bln
+1.672 bln
8.21%
jan 1, 2007
25.064 bln
+3.028 bln
13.74%
jan 1, 2008
31.586 bln
+6.521 bln
26.02%
jan 1, 2009
37.499 bln
+5.913 bln
18.72%
jan 1, 2010
18.257 bln
-19.242 bln
-51.31%
jan 1, 2011
23.871 bln
+5.614 bln
30.75%
jan 1, 2012
25.737 bln
+1.866 bln
7.82%
jan 1, 2013
1.341 bln
-24.395 bln
-94.79%
jan 1, 2014
16.011 bln
+14.67 bln
1.09K%
jan 1, 2015
13.187 bln
-2.825 bln
-17.64%
jan 1, 2016
13.513 bln
+326.055 mln
2.47%
Ranking of countries by current statistics by years


Comments: