29
/
en
AIzaSyAYiBZKx7MnpbEhh9jyipgxe19OcubqV5w
April 1, 2024
287285
Zimbabwe
ZWE
true
2
1
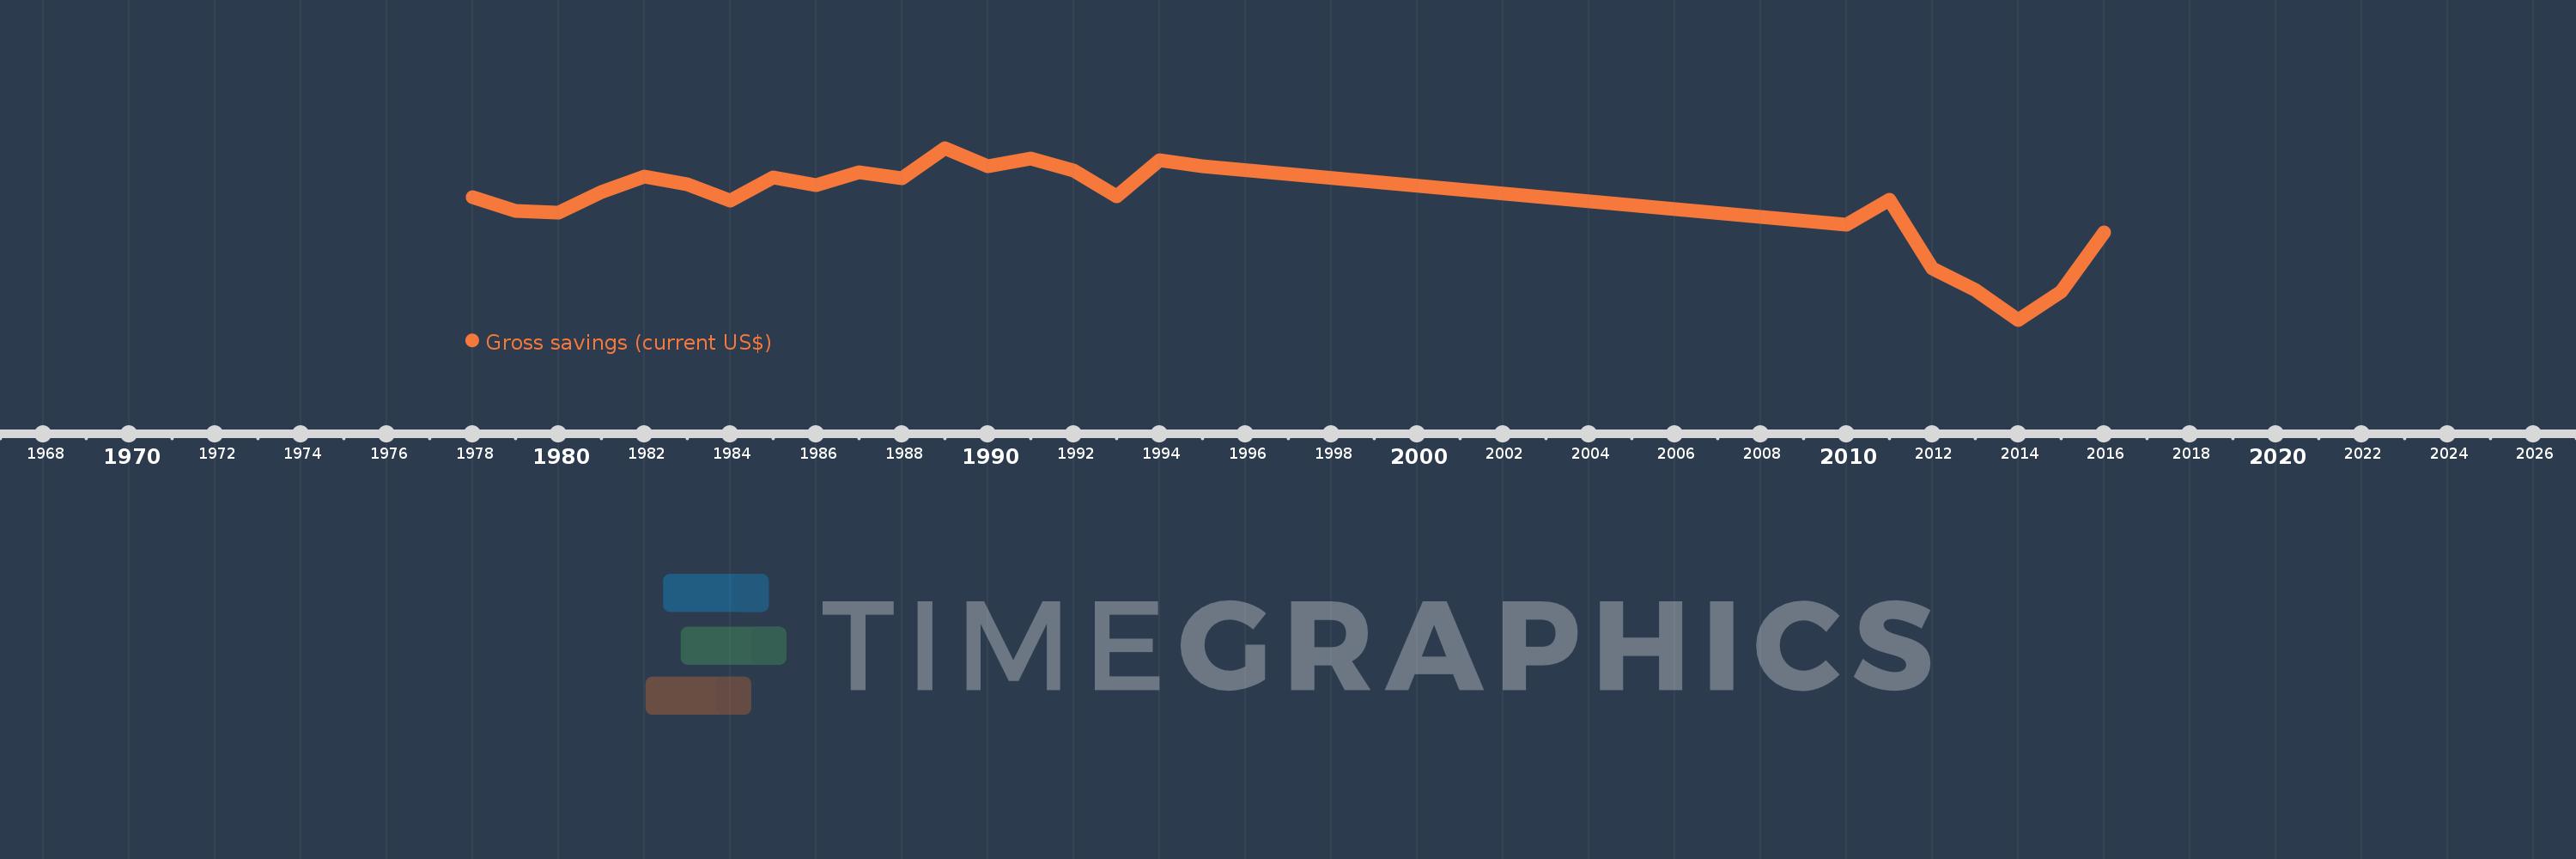
Gross savings (current US$)
2016,2015,2014,2013,2012,2011,2010,1995,1994,1993,1992,1991,1990,1989,1988,1987,1986,1985,1984,1983,1982,1981,1980,1979,1978
This statistics in other country:
AfghanistanAlbaniaAlgeriaAngolaAntigua and BarbudaArgentinaArmeniaAustraliaAustriaAzerbaijanBahamas, TheBahrainBangladeshBarbadosBelarusBelgiumBelizeBeninBermudaBhutanBoliviaBosnia and HerzegovinaBotswanaBrazilBrunei DarussalamBulgariaBurkina FasoBurundiCabo VerdeCambodiaCameroonCanadaCentral African RepublicChadChileChinaColombiaComorosCongo, Dem. Rep.Congo, Rep.Costa RicaCote d'IvoireCroatiaCyprusCzech RepublicDenmarkDjiboutiDominicaDominican RepublicEcuadorEgypt, Arab Rep.El SalvadorEquatorial GuineaEritreaEstoniaEthiopiaFaroe IslandsFijiFinlandFranceGabonGambia, TheGeorgiaGermanyGhanaGreeceGrenadaGuatemalaGuineaGuinea-BissauGuyanaHaitiHondurasHong Kong SAR, ChinaHungaryIcelandIndiaIndonesiaIran, Islamic Rep.IraqIrelandIsraelItalyJamaicaJapanJordanKazakhstanKenyaKiribatiKorea, Rep.KosovoKuwaitKyrgyz RepublicLao PDRLatviaLebanonLesothoLiberiaLibyaLithuaniaLuxembourgMacao SAR, ChinaMacedonia, FYRMadagascarMalawiMalaysiaMaldivesMaliMaltaMauritaniaMauritiusMexicoMoldovaMongoliaMontenegroMoroccoMozambiqueNamibiaNepalNetherlandsNew ZealandNicaraguaNigerNigeriaNorwayOmanPakistanPanamaPapua New GuineaParaguayPeruPhilippinesPolandPortugalQatarRomaniaRussian FederationRwandaSaudi ArabiaSenegalSerbiaSeychellesSierra LeoneSingaporeSlovak RepublicSloveniaSolomon IslandsSouth AfricaSouth SudanSpainSri LankaSt. Kitts and NevisSt. LuciaSt. Vincent and the GrenadinesSudanSurinameSwazilandSwedenSwitzerlandSyrian Arab RepublicTajikistanTanzaniaThailandTimor-LesteTogoTongaTrinidad and TobagoTunisiaTurkeyUgandaUkraineUnited KingdomUnited StatesUruguayVanuatuVenezuela, RBVietnamWest Bank and GazaYemen, Rep.ZambiaZimbabwe Timeline:
This timeline shows a graph from 1978 to 2016 of Zimbabwe. No data until 1977. Number of actual observations by date: 25.
Source name:
World Development Indicators
Source organization:
World Bank national accounts data, and OECD National Accounts data files.
Categories, topics:
Economy & Growth
Last updated:
apr 23, 2017
Indicators value changes by year
Minimum:
-1.33 bln
jan 1, 2014
Maximum:
1.547 bln
jan 1, 1989
At the date of observation
Value
Absolute change
Change from previous value
jan 1, 1978
726.3 mln
+726.3 mln
0.0%
jan 1, 1979
493.78 mln
-232.52 mln
-32.01%
jan 1, 1980
463.925 mln
-29.855 mln
-6.05%
jan 1, 1981
802.432 mln
+338.507 mln
72.97%
jan 1, 1982
1.075 bln
+272.119 mln
33.91%
jan 1, 1983
943.088 mln
-131.462 mln
-12.23%
jan 1, 1984
666.226 mln
-276.863 mln
-29.36%
jan 1, 1985
1.051 bln
+384.452 mln
57.71%
jan 1, 1986
920.785 mln
-129.893 mln
-12.36%
jan 1, 1987
1.138 bln
+216.735 mln
23.54%
jan 1, 1988
1.035 bln
-102.33 mln
-9.0%
jan 1, 1989
1.547 bln
+511.547 mln
49.42%
jan 1, 1990
1.234 bln
-312.286 mln
-20.19%
jan 1, 1991
1.373 bln
+138.501 mln
11.22%
jan 1, 1992
1.164 bln
-209.282 mln
-15.24%
jan 1, 1993
743.5 mln
-420.169 mln
-36.11%
jan 1, 1994
1.339 bln
+595.633 mln
80.11%
jan 1, 1995
1.246 bln
-92.747 mln
-6.93%
jan 1, 2010
265.01 mln
-981.376 mln
-78.74%
jan 1, 2011
686.021 mln
+421.011 mln
158.87%
jan 1, 2012
-469.559 mln
-1.156 bln
-168.45%
jan 1, 2013
-834.254 mln
-364.695 mln
77.67%
jan 1, 2014
-1.33 bln
-496.012 mln
59.46%
jan 1, 2015
-853.294 mln
+476.972 mln
-35.86%
jan 1, 2016
133.593 mln
+986.887 mln
-115.66%
Ranking of countries by current statistics by years


Comments: