29
/
en
AIzaSyAYiBZKx7MnpbEhh9jyipgxe19OcubqV5w
April 1, 2024
211784
Niger
NER
true
2
1
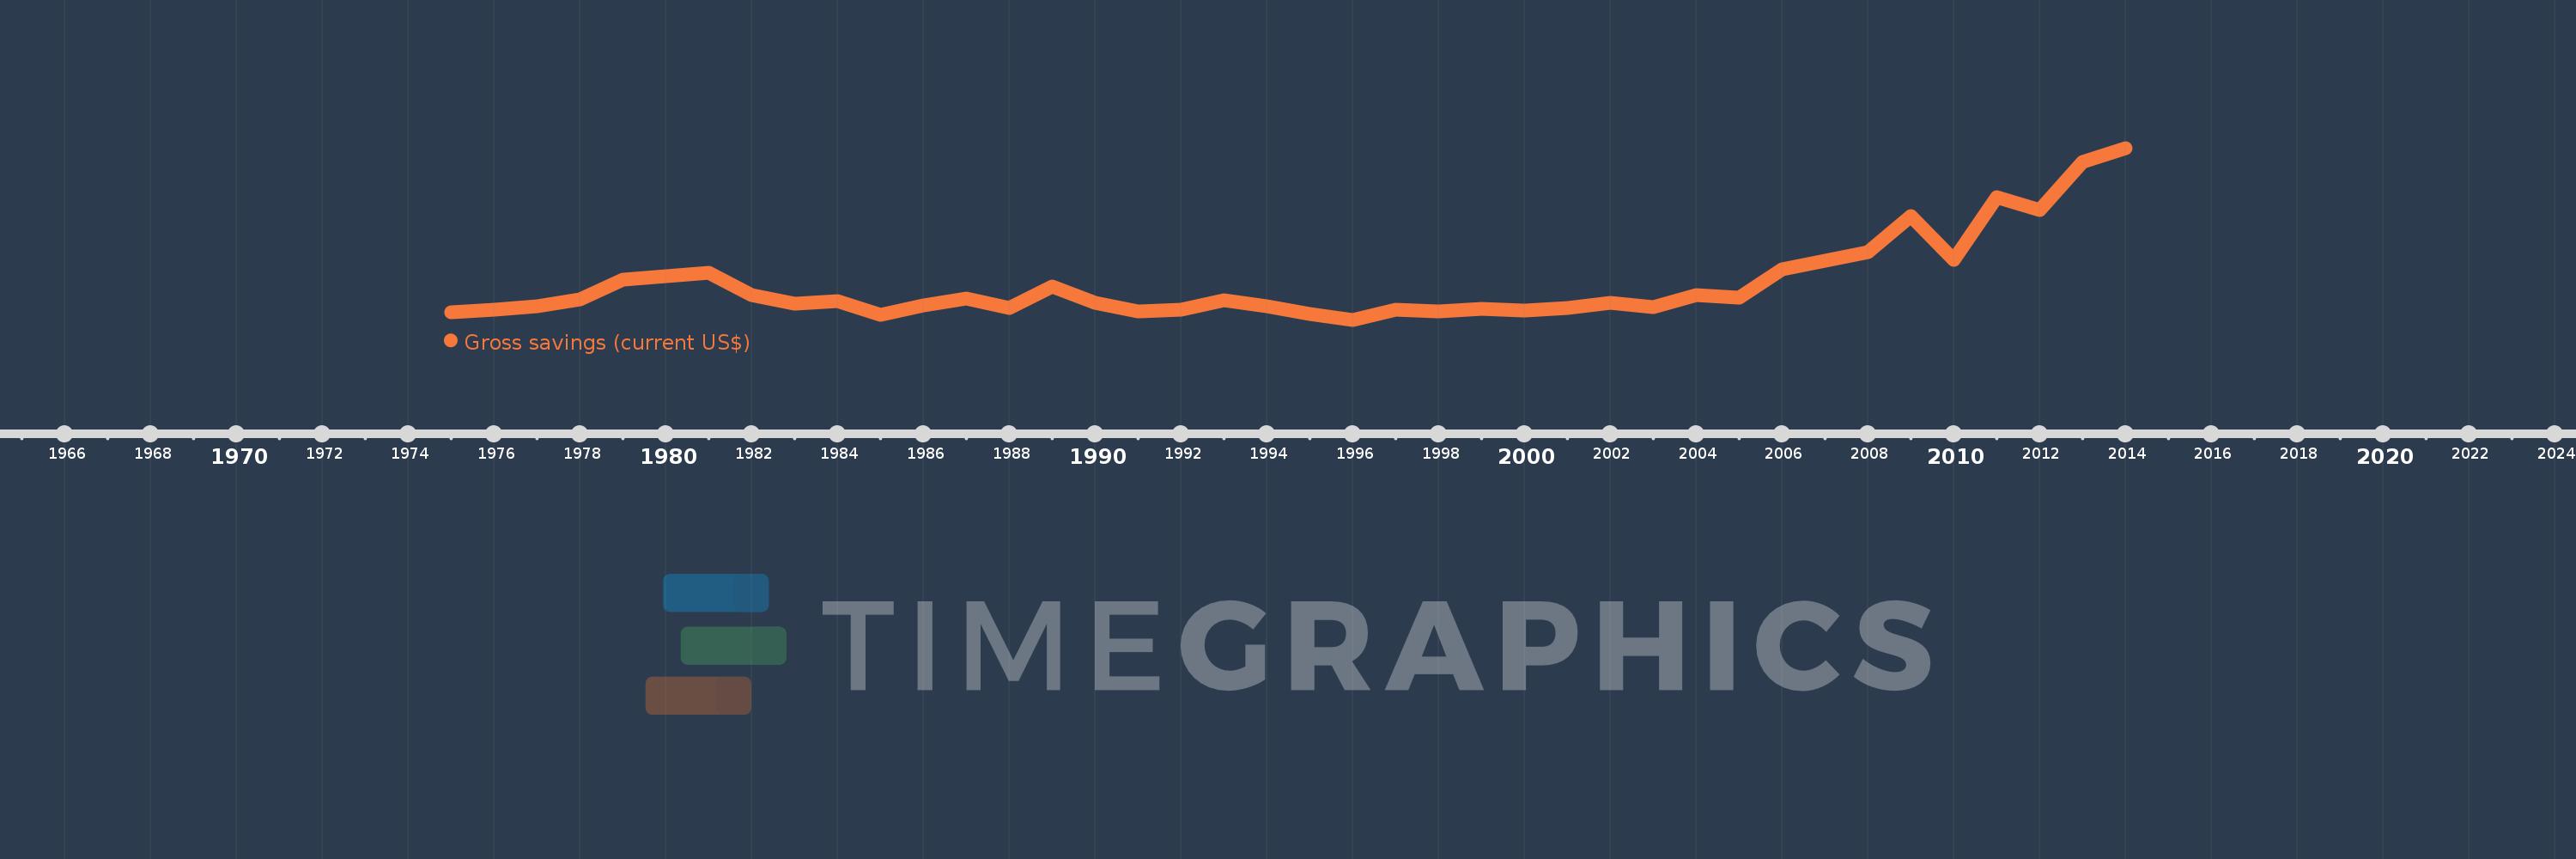
Gross savings (current US$)
2014,2013,2012,2011,2010,2009,2008,2007,2006,2005,2004,2003,2002,2001,2000,1999,1998,1997,1996,1995,1994,1993,1992,1991,1990,1989,1988,1987,1986,1985,1984,1983,1982,1981,1980,1979,1978,1977,1976,1975
This statistics in other country:
AfghanistanAlbaniaAlgeriaAngolaAntigua and BarbudaArgentinaArmeniaAustraliaAustriaAzerbaijanBahamas, TheBahrainBangladeshBarbadosBelarusBelgiumBelizeBeninBermudaBhutanBoliviaBosnia and HerzegovinaBotswanaBrazilBrunei DarussalamBulgariaBurkina FasoBurundiCabo VerdeCambodiaCameroonCanadaCentral African RepublicChadChileChinaColombiaComorosCongo, Dem. Rep.Congo, Rep.Costa RicaCote d'IvoireCroatiaCyprusCzech RepublicDenmarkDjiboutiDominicaDominican RepublicEcuadorEgypt, Arab Rep.El SalvadorEquatorial GuineaEritreaEstoniaEthiopiaFaroe IslandsFijiFinlandFranceGabonGambia, TheGeorgiaGermanyGhanaGreeceGrenadaGuatemalaGuineaGuinea-BissauGuyanaHaitiHondurasHong Kong SAR, ChinaHungaryIcelandIndiaIndonesiaIran, Islamic Rep.IraqIrelandIsraelItalyJamaicaJapanJordanKazakhstanKenyaKiribatiKorea, Rep.KosovoKuwaitKyrgyz RepublicLao PDRLatviaLebanonLesothoLiberiaLibyaLithuaniaLuxembourgMacao SAR, ChinaMacedonia, FYRMadagascarMalawiMalaysiaMaldivesMaliMaltaMauritaniaMauritiusMexicoMoldovaMongoliaMontenegroMoroccoMozambiqueNamibiaNepalNetherlandsNew ZealandNicaraguaNigerNigeriaNorwayOmanPakistanPanamaPapua New GuineaParaguayPeruPhilippinesPolandPortugalQatarRomaniaRussian FederationRwandaSaudi ArabiaSenegalSerbiaSeychellesSierra LeoneSingaporeSlovak RepublicSloveniaSolomon IslandsSouth AfricaSouth SudanSpainSri LankaSt. Kitts and NevisSt. LuciaSt. Vincent and the GrenadinesSudanSurinameSwazilandSwedenSwitzerlandSyrian Arab RepublicTajikistanTanzaniaThailandTimor-LesteTogoTongaTrinidad and TobagoTunisiaTurkeyUgandaUkraineUnited KingdomUnited StatesUruguayVanuatuVenezuela, RBVietnamWest Bank and GazaYemen, Rep.ZambiaZimbabwe Timeline:
This timeline shows a graph from 1975 to 2014 of Niger. No data until 1974. Number of actual observations by date: 40.
Source name:
World Development Indicators
Source organization:
World Bank national accounts data, and OECD National Accounts data files.
Categories, topics:
Economy & Growth
Last updated:
apr 23, 2017
Indicators value changes by year
Minimum:
-15.401 mln
jan 1, 1996
Maximum:
1.622 bln
jan 1, 2014
At the date of observation
Value
Absolute change
Change from previous value
jan 1, 1975
55.41 mln
+55.41 mln
0.0%
jan 1, 1976
81.243 mln
+25.833 mln
46.62%
jan 1, 1977
109.789 mln
+28.546 mln
35.14%
jan 1, 1978
181.086 mln
+71.297 mln
64.94%
jan 1, 1979
367.822 mln
+186.736 mln
103.12%
jan 1, 1980
403.222 mln
+35.4 mln
9.62%
jan 1, 1981
429.531 mln
+26.31 mln
6.52%
jan 1, 1982
218.287 mln
-211.244 mln
-49.18%
jan 1, 1983
135.348 mln
-82.939 mln
-38.0%
jan 1, 1984
162.259 mln
+26.912 mln
19.88%
jan 1, 1985
34.632 mln
-127.628 mln
-78.66%
jan 1, 1986
119.624 mln
+84.992 mln
245.42%
jan 1, 1987
188.474 mln
+68.85 mln
57.56%
jan 1, 1988
97.392 mln
-91.082 mln
-48.33%
jan 1, 1989
303.588 mln
+206.197 mln
211.72%
jan 1, 1990
148.612 mln
-154.976 mln
-51.05%
jan 1, 1991
61.338 mln
-87.274 mln
-58.73%
jan 1, 1992
82.487 mln
+21.15 mln
34.48%
jan 1, 1993
174.287 mln
+91.8 mln
111.29%
jan 1, 1994
113.949 mln
-60.338 mln
-34.62%
jan 1, 1995
36.561 mln
-77.388 mln
-67.91%
jan 1, 1996
-15.401 mln
-51.963 mln
-142.12%
jan 1, 1997
82.063 mln
+97.464 mln
-632.83%
jan 1, 1998
65.434 mln
-16.629 mln
-20.26%
jan 1, 1999
91.008 mln
+25.573 mln
39.08%
jan 1, 2000
74.457 mln
-16.551 mln
-18.19%
jan 1, 2001
94.54 mln
+20.083 mln
26.97%
jan 1, 2002
143.093 mln
+48.553 mln
51.36%
jan 1, 2003
106.808 mln
-36.284 mln
-25.36%
jan 1, 2004
216.41 mln
+109.602 mln
102.62%
jan 1, 2005
191.902 mln
-24.508 mln
-11.32%
jan 1, 2006
466.476 mln
+274.574 mln
143.08%
jan 1, 2007
547.012 mln
+80.536 mln
17.26%
jan 1, 2008
631.186 mln
+84.175 mln
15.39%
jan 1, 2009
975.045 mln
+343.858 mln
54.48%
jan 1, 2010
558.939 mln
-416.105 mln
-42.68%
jan 1, 2011
1.151 bln
+592.003 mln
105.92%
jan 1, 2012
1.034 bln
-117.173 mln
-10.18%
jan 1, 2013
1.49 bln
+456.048 mln
44.12%
jan 1, 2014
1.622 bln
+131.924 mln
8.86%
Ranking of countries by current statistics by years


Comments: