29
/
en
AIzaSyAYiBZKx7MnpbEhh9jyipgxe19OcubqV5w
April 1, 2024
260977
Tanzania
TZA
true
2
1
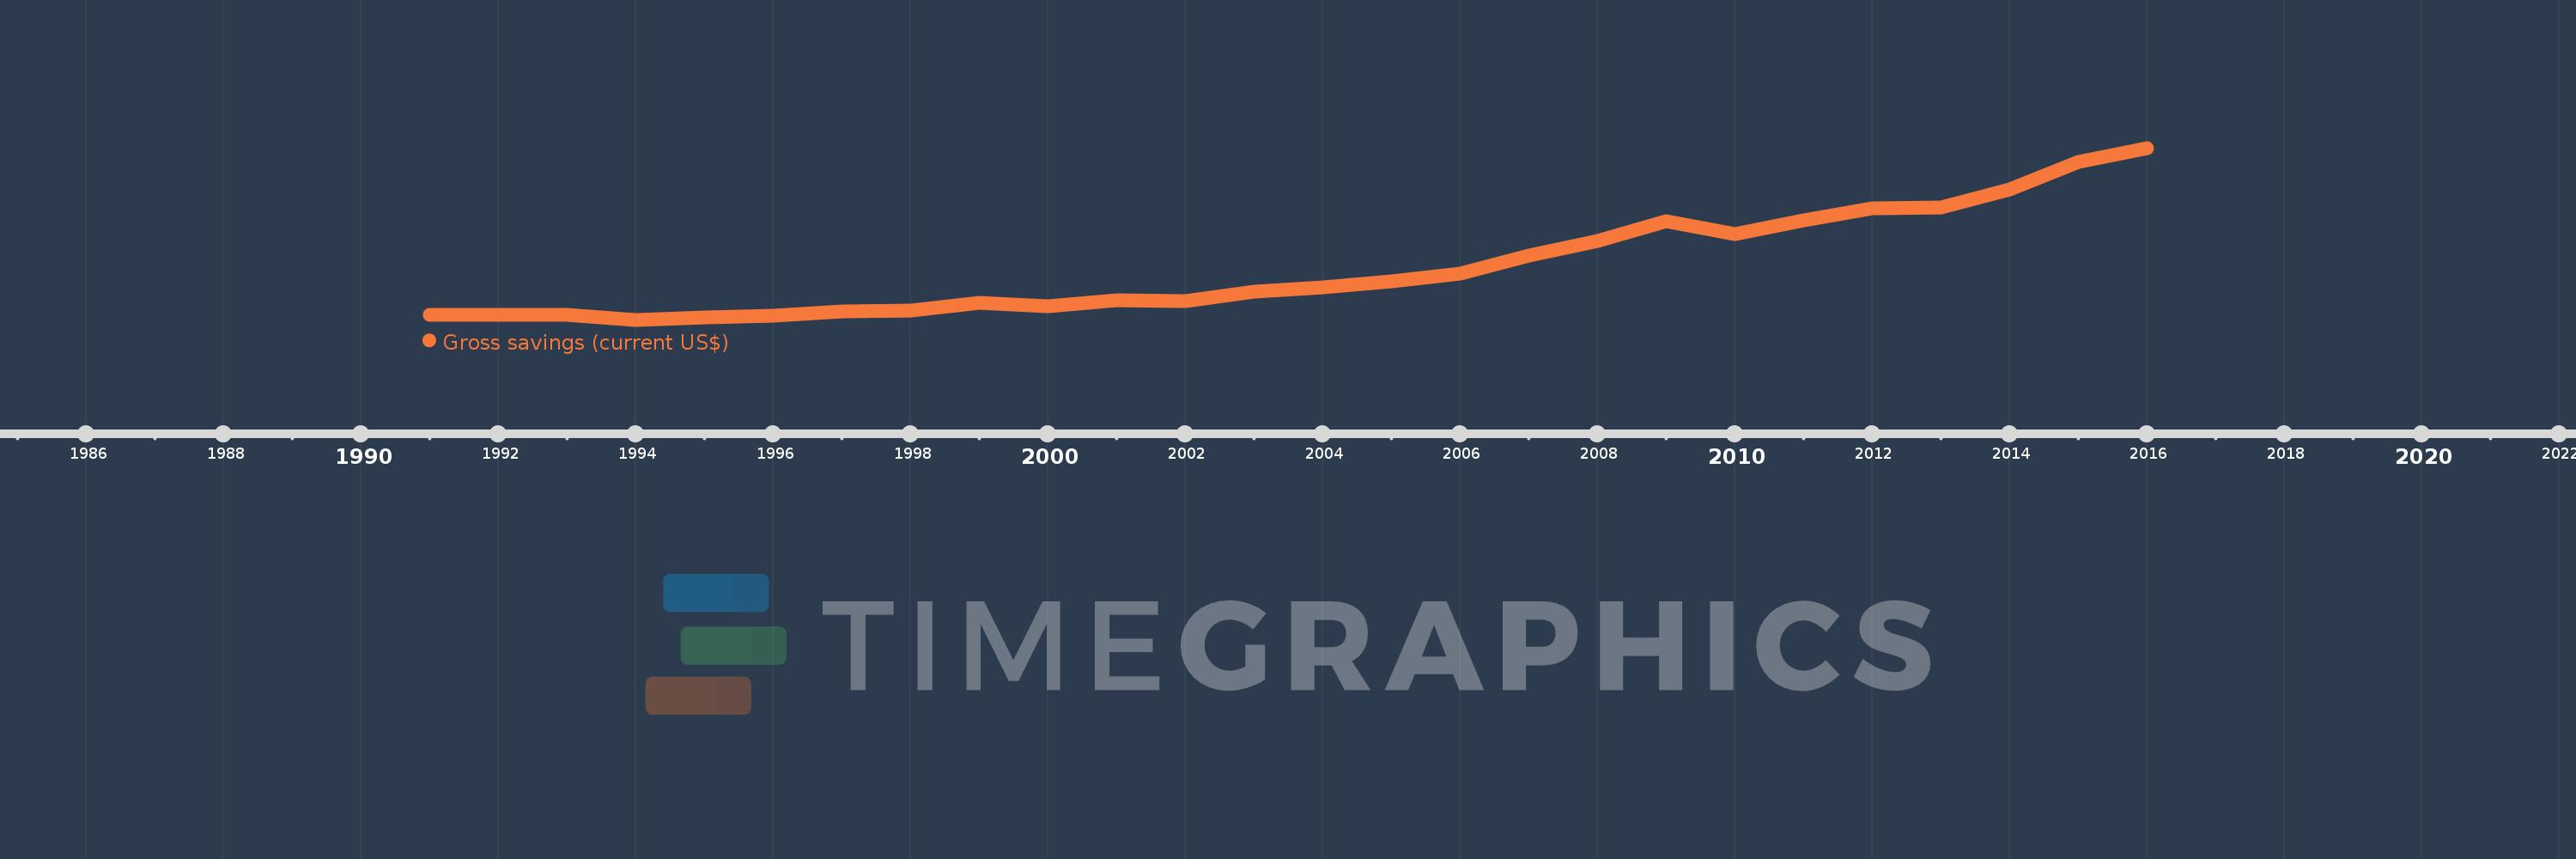
Gross savings (current US$)
2016,2015,2014,2013,2012,2011,2010,2009,2008,2007,2006,2005,2004,2003,2002,2001,2000,1999,1998,1997,1996,1995,1994,1993,1992,1991
This statistics in other country:
AfghanistanAlbaniaAlgeriaAngolaAntigua and BarbudaArgentinaArmeniaAustraliaAustriaAzerbaijanBahamas, TheBahrainBangladeshBarbadosBelarusBelgiumBelizeBeninBermudaBhutanBoliviaBosnia and HerzegovinaBotswanaBrazilBrunei DarussalamBulgariaBurkina FasoBurundiCabo VerdeCambodiaCameroonCanadaCentral African RepublicChadChileChinaColombiaComorosCongo, Dem. Rep.Congo, Rep.Costa RicaCote d'IvoireCroatiaCyprusCzech RepublicDenmarkDjiboutiDominicaDominican RepublicEcuadorEgypt, Arab Rep.El SalvadorEquatorial GuineaEritreaEstoniaEthiopiaFaroe IslandsFijiFinlandFranceGabonGambia, TheGeorgiaGermanyGhanaGreeceGrenadaGuatemalaGuineaGuinea-BissauGuyanaHaitiHondurasHong Kong SAR, ChinaHungaryIcelandIndiaIndonesiaIran, Islamic Rep.IraqIrelandIsraelItalyJamaicaJapanJordanKazakhstanKenyaKiribatiKorea, Rep.KosovoKuwaitKyrgyz RepublicLao PDRLatviaLebanonLesothoLiberiaLibyaLithuaniaLuxembourgMacao SAR, ChinaMacedonia, FYRMadagascarMalawiMalaysiaMaldivesMaliMaltaMauritaniaMauritiusMexicoMoldovaMongoliaMontenegroMoroccoMozambiqueNamibiaNepalNetherlandsNew ZealandNicaraguaNigerNigeriaNorwayOmanPakistanPanamaPapua New GuineaParaguayPeruPhilippinesPolandPortugalQatarRomaniaRussian FederationRwandaSaudi ArabiaSenegalSerbiaSeychellesSierra LeoneSingaporeSlovak RepublicSloveniaSolomon IslandsSouth AfricaSouth SudanSpainSri LankaSt. Kitts and NevisSt. LuciaSt. Vincent and the GrenadinesSudanSurinameSwazilandSwedenSwitzerlandSyrian Arab RepublicTajikistanTanzaniaThailandTimor-LesteTogoTongaTrinidad and TobagoTunisiaTurkeyUgandaUkraineUnited KingdomUnited StatesUruguayVanuatuVenezuela, RBVietnamWest Bank and GazaYemen, Rep.ZambiaZimbabwe Timeline:
This timeline shows a graph from 1991 to 2016 of Tanzania. No data until 1990. Number of actual observations by date: 26.
Source name:
World Development Indicators
Source organization:
World Bank national accounts data, and OECD National Accounts data files.
Categories, topics:
Economy & Growth
Last updated:
apr 23, 2017
Indicators value changes by year
Minimum:
152.473 mln
jan 1, 1994
Maximum:
10.288 bln
jan 1, 2016
At the date of observation
Value
Absolute change
Change from previous value
jan 1, 1991
429.753 mln
+429.753 mln
0.0%
jan 1, 1992
432.969 mln
+3.216 mln
0.75%
jan 1, 1993
442.245 mln
+9.276 mln
2.14%
jan 1, 1994
152.473 mln
-289.771 mln
-65.52%
jan 1, 1995
280.185 mln
+127.711 mln
83.76%
jan 1, 1996
389.107 mln
+108.922 mln
38.88%
jan 1, 1997
665.54 mln
+276.433 mln
71.04%
jan 1, 1998
697.806 mln
+32.266 mln
4.85%
jan 1, 1999
1.154 bln
+456.367 mln
65.4%
jan 1, 2000
941.271 mln
-212.902 mln
-18.45%
jan 1, 2001
1.285 bln
+343.563 mln
36.5%
jan 1, 2002
1.247 bln
-38.013 mln
-2.96%
jan 1, 2003
1.812 bln
+564.88 mln
45.31%
jan 1, 2004
2.056 bln
+243.999 mln
13.47%
jan 1, 2005
2.431 bln
+375.255 mln
18.25%
jan 1, 2006
2.886 bln
+455.44 mln
18.74%
jan 1, 2007
3.941 bln
+1.054 bln
36.53%
jan 1, 2008
4.776 bln
+834.996 mln
21.19%
jan 1, 2009
5.976 bln
+1.2 bln
25.13%
jan 1, 2010
5.228 bln
-747.42 mln
-12.51%
jan 1, 2011
6.033 bln
+804.528 mln
15.39%
jan 1, 2012
6.727 bln
+693.669 mln
11.5%
jan 1, 2013
6.752 bln
+25.757 mln
0.38%
jan 1, 2014
7.86 bln
+1.107 bln
16.4%
jan 1, 2015
9.481 bln
+1.621 bln
20.62%
jan 1, 2016
10.288 bln
+806.873 mln
8.51%
Ranking of countries by current statistics by years


Comments: