29
/
en
AIzaSyAYiBZKx7MnpbEhh9jyipgxe19OcubqV5w
April 1, 2024
241673
Slovak Republic
SVK
true
2
1
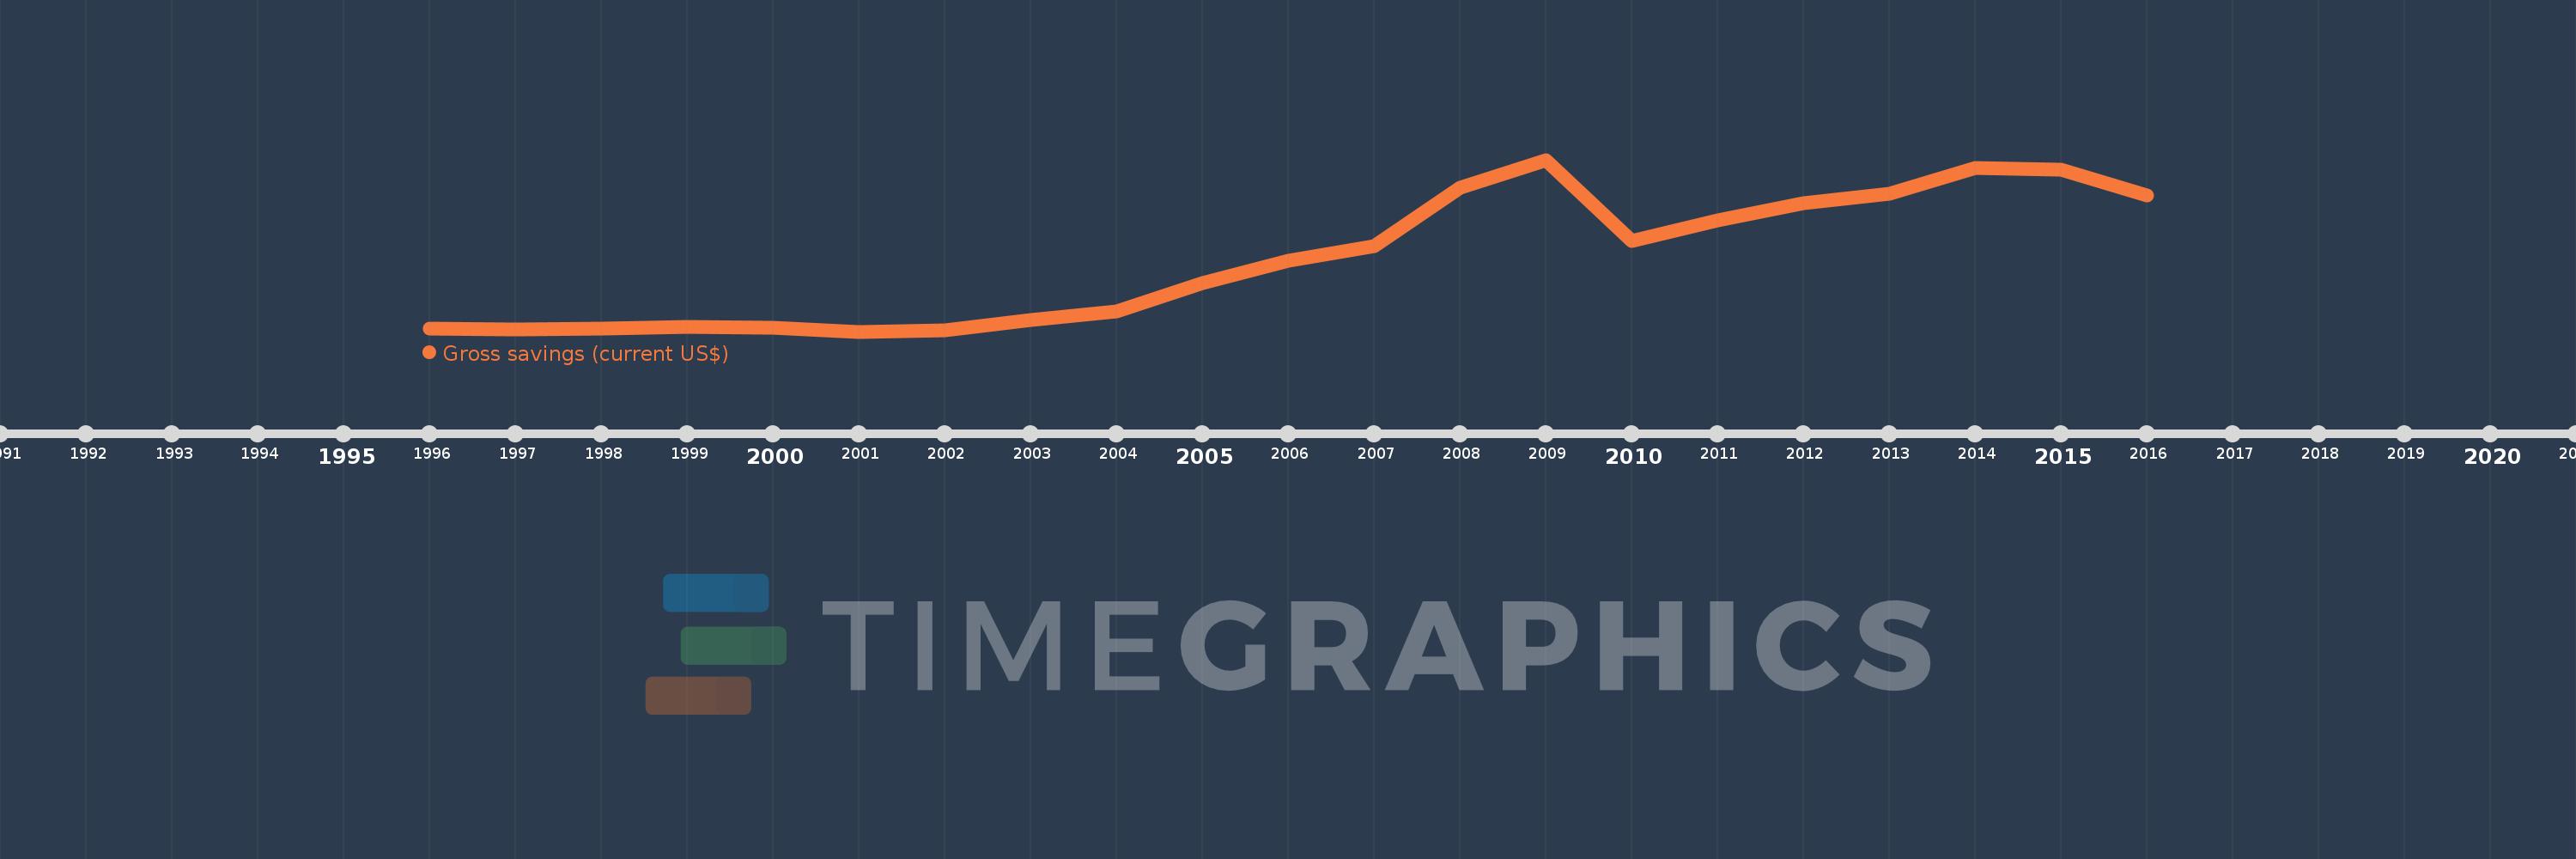
Gross savings (current US$)
2016,2015,2014,2013,2012,2011,2010,2009,2008,2007,2006,2005,2004,2003,2002,2001,2000,1999,1998,1997,1996
This statistics in other country:
AfghanistanAlbaniaAlgeriaAngolaAntigua and BarbudaArgentinaArmeniaAustraliaAustriaAzerbaijanBahamas, TheBahrainBangladeshBarbadosBelarusBelgiumBelizeBeninBermudaBhutanBoliviaBosnia and HerzegovinaBotswanaBrazilBrunei DarussalamBulgariaBurkina FasoBurundiCabo VerdeCambodiaCameroonCanadaCentral African RepublicChadChileChinaColombiaComorosCongo, Dem. Rep.Congo, Rep.Costa RicaCote d'IvoireCroatiaCyprusCzech RepublicDenmarkDjiboutiDominicaDominican RepublicEcuadorEgypt, Arab Rep.El SalvadorEquatorial GuineaEritreaEstoniaEthiopiaFaroe IslandsFijiFinlandFranceGabonGambia, TheGeorgiaGermanyGhanaGreeceGrenadaGuatemalaGuineaGuinea-BissauGuyanaHaitiHondurasHong Kong SAR, ChinaHungaryIcelandIndiaIndonesiaIran, Islamic Rep.IraqIrelandIsraelItalyJamaicaJapanJordanKazakhstanKenyaKiribatiKorea, Rep.KosovoKuwaitKyrgyz RepublicLao PDRLatviaLebanonLesothoLiberiaLibyaLithuaniaLuxembourgMacao SAR, ChinaMacedonia, FYRMadagascarMalawiMalaysiaMaldivesMaliMaltaMauritaniaMauritiusMexicoMoldovaMongoliaMontenegroMoroccoMozambiqueNamibiaNepalNetherlandsNew ZealandNicaraguaNigerNigeriaNorwayOmanPakistanPanamaPapua New GuineaParaguayPeruPhilippinesPolandPortugalQatarRomaniaRussian FederationRwandaSaudi ArabiaSenegalSerbiaSeychellesSierra LeoneSingaporeSlovak RepublicSloveniaSolomon IslandsSouth AfricaSouth SudanSpainSri LankaSt. Kitts and NevisSt. LuciaSt. Vincent and the GrenadinesSudanSurinameSwazilandSwedenSwitzerlandSyrian Arab RepublicTajikistanTanzaniaThailandTimor-LesteTogoTongaTrinidad and TobagoTunisiaTurkeyUgandaUkraineUnited KingdomUnited StatesUruguayVanuatuVenezuela, RBVietnamWest Bank and GazaYemen, Rep.ZambiaZimbabwe Timeline:
This timeline shows a graph from 1996 to 2016 of Slovak Republic. No data until 1995. Number of actual observations by date: 21.
Source name:
World Development Indicators
Source organization:
World Bank national accounts data, and OECD National Accounts data files.
Categories, topics:
Economy & Growth
Last updated:
apr 23, 2017
Indicators value changes by year
Minimum:
7.255 bln
jan 1, 2001
Maximum:
22.939 bln
jan 1, 2009
At the date of observation
Value
Absolute change
Change from previous value
jan 1, 1996
7.561 bln
+7.561 bln
0.0%
jan 1, 1997
7.444 bln
-117.147 mln
-1.55%
jan 1, 1998
7.551 bln
+107.404 mln
1.44%
jan 1, 1999
7.679 bln
+127.726 mln
1.69%
jan 1, 2000
7.596 bln
-83.019 mln
-1.08%
jan 1, 2001
7.255 bln
-340.99 mln
-4.49%
jan 1, 2002
7.382 bln
+126.918 mln
1.75%
jan 1, 2003
8.303 bln
+921.468 mln
12.48%
jan 1, 2004
9.073 bln
+769.868 mln
9.27%
jan 1, 2005
11.719 bln
+2.646 bln
29.17%
jan 1, 2006
13.75 bln
+2.03 bln
17.32%
jan 1, 2007
15.051 bln
+1.302 bln
9.47%
jan 1, 2008
20.393 bln
+5.342 bln
35.49%
jan 1, 2009
22.939 bln
+2.546 bln
12.49%
jan 1, 2010
15.505 bln
-7.434 bln
-32.41%
jan 1, 2011
17.446 bln
+1.941 bln
12.52%
jan 1, 2012
18.951 bln
+1.505 bln
8.63%
jan 1, 2013
19.86 bln
+909.129 mln
4.8%
jan 1, 2014
22.159 bln
+2.299 bln
11.57%
jan 1, 2015
22.075 bln
-83.352 mln
-0.38%
jan 1, 2016
19.704 bln
-2.372 bln
-10.74%
Ranking of countries by current statistics by years


Comments: