29
/
en
AIzaSyAYiBZKx7MnpbEhh9jyipgxe19OcubqV5w
April 1, 2024
92656
Brunei Darussalam
BRN
true
2
1
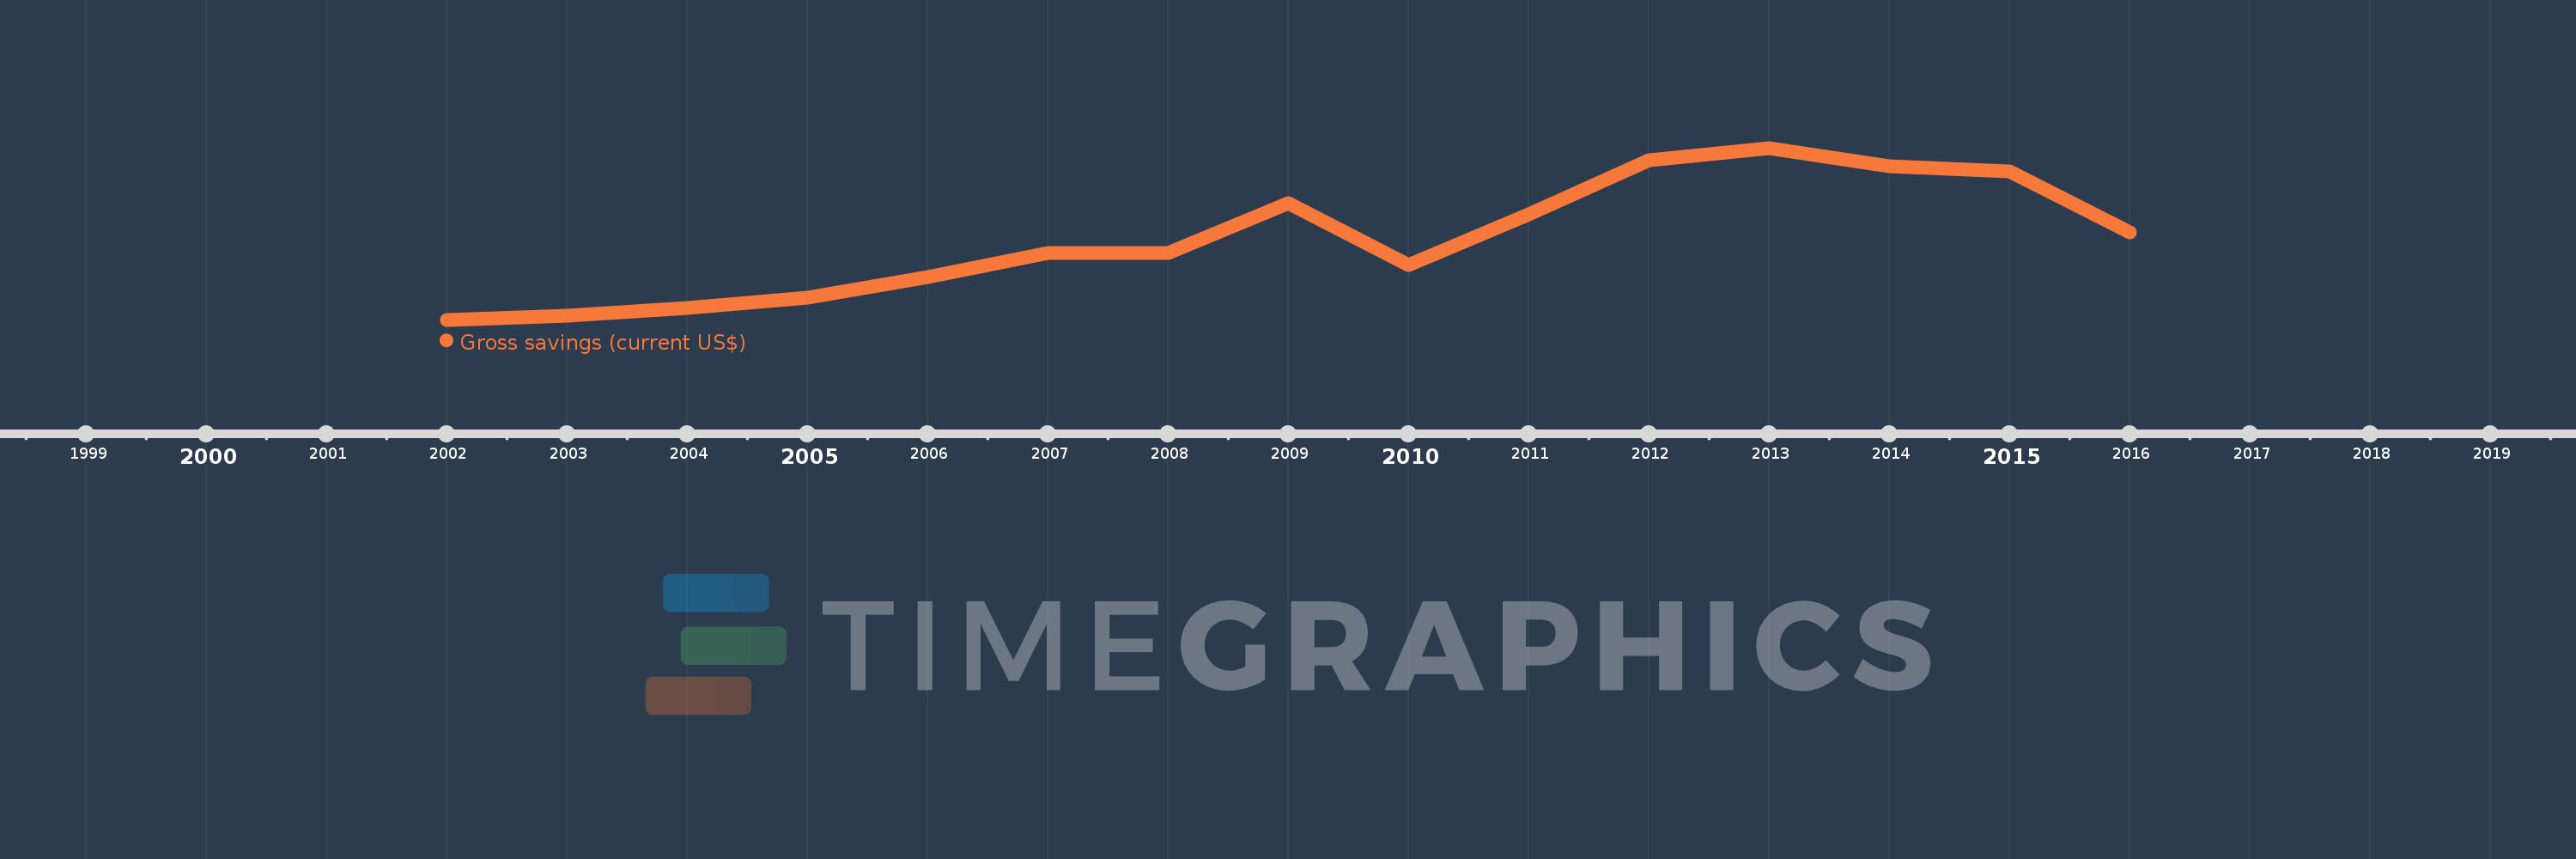
Gross savings (current US$)
2016,2015,2014,2013,2012,2011,2010,2009,2008,2007,2006,2005,2004,2003,2002
This statistics in other country:
AfghanistanAlbaniaAlgeriaAngolaAntigua and BarbudaArgentinaArmeniaAustraliaAustriaAzerbaijanBahamas, TheBahrainBangladeshBarbadosBelarusBelgiumBelizeBeninBermudaBhutanBoliviaBosnia and HerzegovinaBotswanaBrazilBrunei DarussalamBulgariaBurkina FasoBurundiCabo VerdeCambodiaCameroonCanadaCentral African RepublicChadChileChinaColombiaComorosCongo, Dem. Rep.Congo, Rep.Costa RicaCote d'IvoireCroatiaCyprusCzech RepublicDenmarkDjiboutiDominicaDominican RepublicEcuadorEgypt, Arab Rep.El SalvadorEquatorial GuineaEritreaEstoniaEthiopiaFaroe IslandsFijiFinlandFranceGabonGambia, TheGeorgiaGermanyGhanaGreeceGrenadaGuatemalaGuineaGuinea-BissauGuyanaHaitiHondurasHong Kong SAR, ChinaHungaryIcelandIndiaIndonesiaIran, Islamic Rep.IraqIrelandIsraelItalyJamaicaJapanJordanKazakhstanKenyaKiribatiKorea, Rep.KosovoKuwaitKyrgyz RepublicLao PDRLatviaLebanonLesothoLiberiaLibyaLithuaniaLuxembourgMacao SAR, ChinaMacedonia, FYRMadagascarMalawiMalaysiaMaldivesMaliMaltaMauritaniaMauritiusMexicoMoldovaMongoliaMontenegroMoroccoMozambiqueNamibiaNepalNetherlandsNew ZealandNicaraguaNigerNigeriaNorwayOmanPakistanPanamaPapua New GuineaParaguayPeruPhilippinesPolandPortugalQatarRomaniaRussian FederationRwandaSaudi ArabiaSenegalSerbiaSeychellesSierra LeoneSingaporeSlovak RepublicSloveniaSolomon IslandsSouth AfricaSouth SudanSpainSri LankaSt. Kitts and NevisSt. LuciaSt. Vincent and the GrenadinesSudanSurinameSwazilandSwedenSwitzerlandSyrian Arab RepublicTajikistanTanzaniaThailandTimor-LesteTogoTongaTrinidad and TobagoTunisiaTurkeyUgandaUkraineUnited KingdomUnited StatesUruguayVanuatuVenezuela, RBVietnamWest Bank and GazaYemen, Rep.ZambiaZimbabwe Timeline:
This timeline shows a graph from 2002 to 2016 of Brunei Darussalam. No data until 2001. Number of actual observations by date: 15.
Source name:
World Development Indicators
Source organization:
World Bank national accounts data, and OECD National Accounts data files.
Categories, topics:
Economy & Growth
Last updated:
apr 23, 2017
Indicators value changes by year
Minimum:
2.409 bln
jan 1, 2002
Maximum:
11.936 bln
jan 1, 2013
At the date of observation
Value
Absolute change
Change from previous value
jan 1, 2002
2.409 bln
+2.409 bln
0.0%
jan 1, 2003
2.643 bln
+233.613 mln
9.7%
jan 1, 2004
3.075 bln
+432.32 mln
16.36%
jan 1, 2005
3.621 bln
+546.183 mln
17.76%
jan 1, 2006
4.795 bln
+1.173 bln
32.4%
jan 1, 2007
6.127 bln
+1.332 bln
27.78%
jan 1, 2008
6.116 bln
-10.576 mln
-0.17%
jan 1, 2009
8.896 bln
+2.78 bln
45.46%
jan 1, 2010
5.462 bln
-3.435 bln
-38.61%
jan 1, 2011
8.246 bln
+2.784 bln
50.97%
jan 1, 2012
11.26 bln
+3.015 bln
36.56%
jan 1, 2013
11.936 bln
+676.067 mln
6.0%
jan 1, 2014
10.936 bln
-1.0 bln
-8.38%
jan 1, 2015
10.618 bln
-318.502 mln
-2.91%
jan 1, 2016
7.256 bln
-3.362 bln
-31.66%
Ranking of countries by current statistics by years


Comments: