29
/
en
AIzaSyAYiBZKx7MnpbEhh9jyipgxe19OcubqV5w
April 1, 2024
193100
Mauritania
MRT
true
2
1
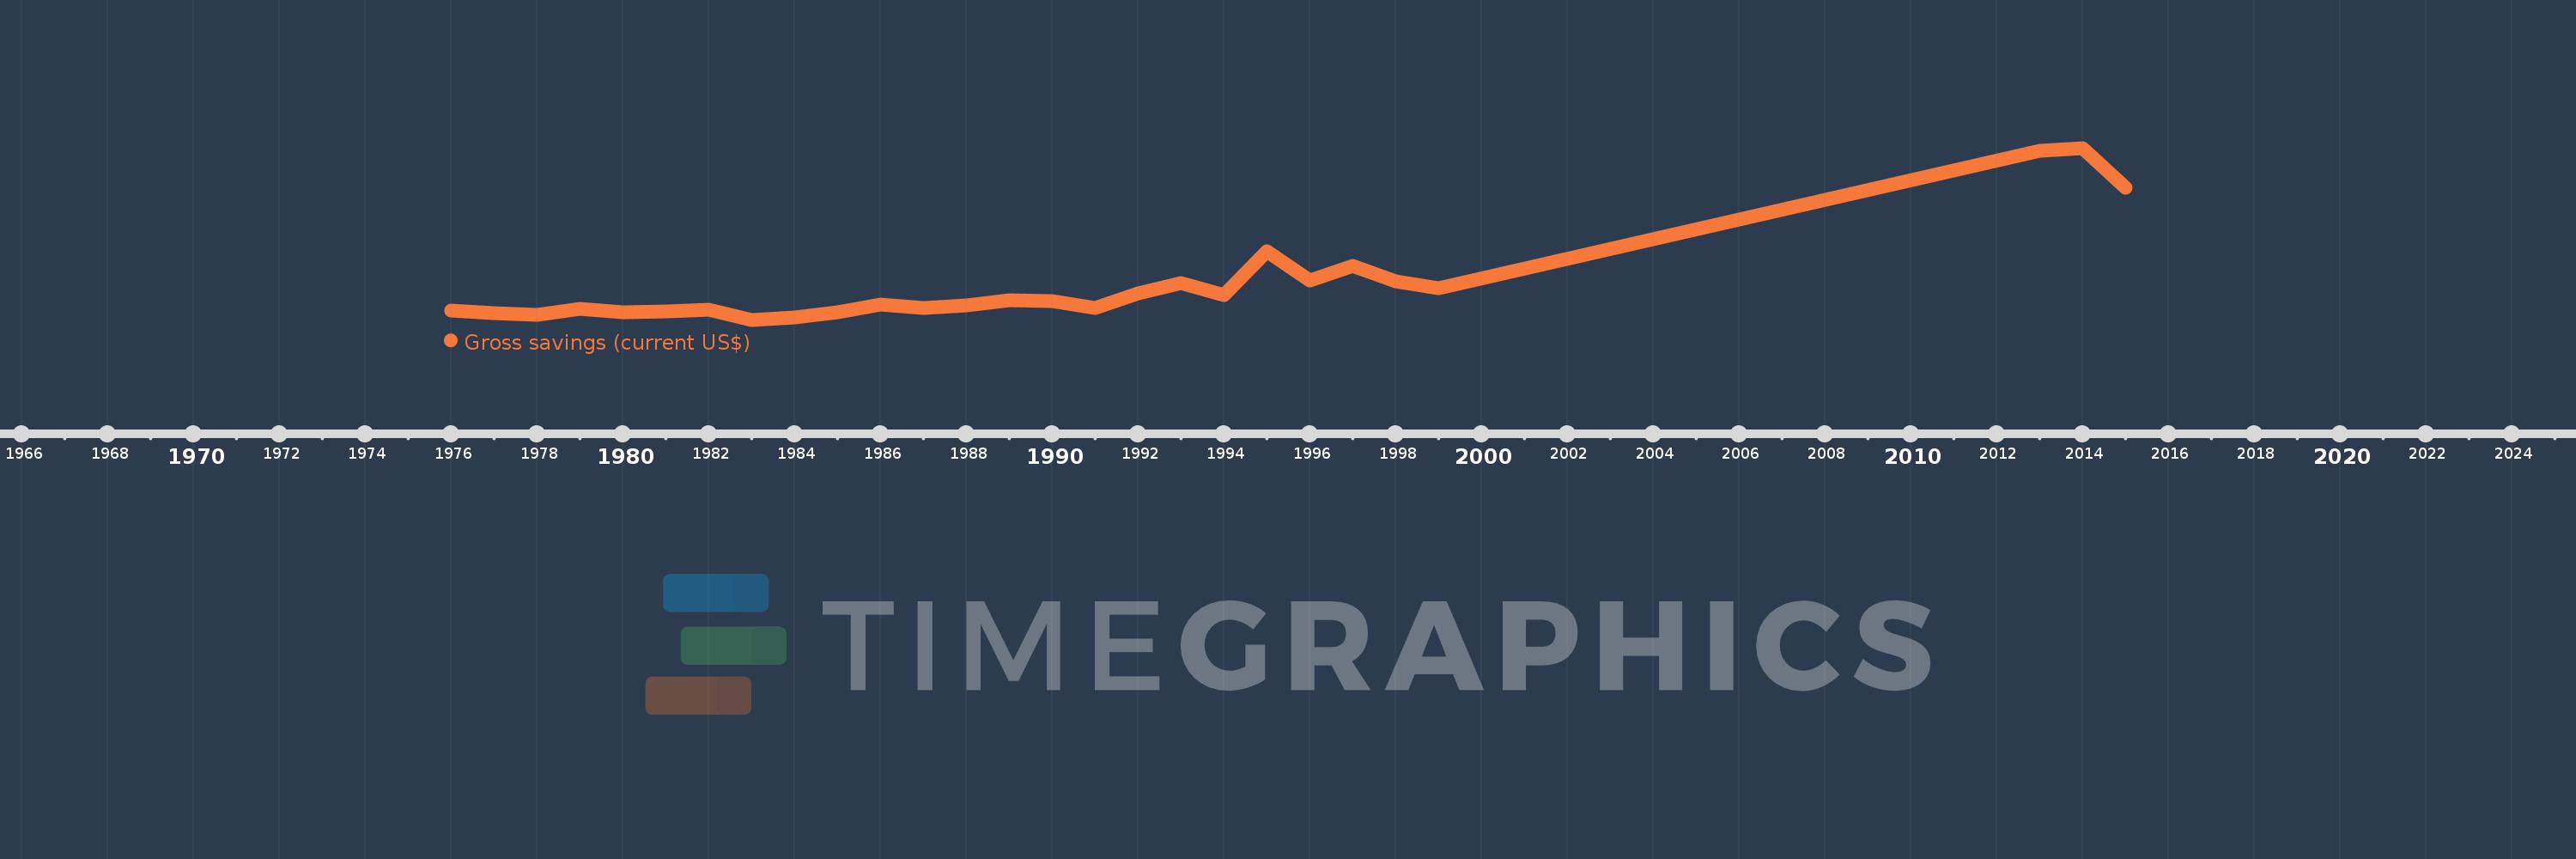
Gross savings (current US$)
2015,2014,2013,1999,1998,1997,1996,1995,1994,1993,1992,1991,1990,1989,1988,1987,1986,1985,1984,1983,1982,1981,1980,1979,1978,1977,1976
This statistics in other country:
AfghanistanAlbaniaAlgeriaAngolaAntigua and BarbudaArgentinaArmeniaAustraliaAustriaAzerbaijanBahamas, TheBahrainBangladeshBarbadosBelarusBelgiumBelizeBeninBermudaBhutanBoliviaBosnia and HerzegovinaBotswanaBrazilBrunei DarussalamBulgariaBurkina FasoBurundiCabo VerdeCambodiaCameroonCanadaCentral African RepublicChadChileChinaColombiaComorosCongo, Dem. Rep.Congo, Rep.Costa RicaCote d'IvoireCroatiaCyprusCzech RepublicDenmarkDjiboutiDominicaDominican RepublicEcuadorEgypt, Arab Rep.El SalvadorEquatorial GuineaEritreaEstoniaEthiopiaFaroe IslandsFijiFinlandFranceGabonGambia, TheGeorgiaGermanyGhanaGreeceGrenadaGuatemalaGuineaGuinea-BissauGuyanaHaitiHondurasHong Kong SAR, ChinaHungaryIcelandIndiaIndonesiaIran, Islamic Rep.IraqIrelandIsraelItalyJamaicaJapanJordanKazakhstanKenyaKiribatiKorea, Rep.KosovoKuwaitKyrgyz RepublicLao PDRLatviaLebanonLesothoLiberiaLibyaLithuaniaLuxembourgMacao SAR, ChinaMacedonia, FYRMadagascarMalawiMalaysiaMaldivesMaliMaltaMauritaniaMauritiusMexicoMoldovaMongoliaMontenegroMoroccoMozambiqueNamibiaNepalNetherlandsNew ZealandNicaraguaNigerNigeriaNorwayOmanPakistanPanamaPapua New GuineaParaguayPeruPhilippinesPolandPortugalQatarRomaniaRussian FederationRwandaSaudi ArabiaSenegalSerbiaSeychellesSierra LeoneSingaporeSlovak RepublicSloveniaSolomon IslandsSouth AfricaSouth SudanSpainSri LankaSt. Kitts and NevisSt. LuciaSt. Vincent and the GrenadinesSudanSurinameSwazilandSwedenSwitzerlandSyrian Arab RepublicTajikistanTanzaniaThailandTimor-LesteTogoTongaTrinidad and TobagoTunisiaTurkeyUgandaUkraineUnited KingdomUnited StatesUruguayVanuatuVenezuela, RBVietnamWest Bank and GazaYemen, Rep.ZambiaZimbabwe Timeline:
This timeline shows a graph from 1976 to 2015 of Mauritania. No data until 1975. Number of actual observations by date: 27.
Source name:
World Development Indicators
Source organization:
World Bank national accounts data, and OECD National Accounts data files.
Categories, topics:
Economy & Growth
Last updated:
apr 23, 2017
Indicators value changes by year
Minimum:
-57.946 mln
jan 1, 1983
Maximum:
1.846 bln
jan 1, 2014
At the date of observation
Value
Absolute change
Change from previous value
jan 1, 1976
43.734 mln
+43.734 mln
0.0%
jan 1, 1977
17.523 mln
-26.211 mln
-59.93%
jan 1, 1978
-5.385 mln
-22.907 mln
-130.73%
jan 1, 1979
62.763 mln
+68.148 mln
-1.27K%
jan 1, 1980
27.591 mln
-35.172 mln
-56.04%
jan 1, 1981
37.923 mln
+10.331 mln
37.44%
jan 1, 1982
52.34 mln
+14.417 mln
38.02%
jan 1, 1983
-57.946 mln
-110.286 mln
-210.71%
jan 1, 1984
-36.113 mln
+21.833 mln
-37.68%
jan 1, 1985
24.821 mln
+60.934 mln
-168.73%
jan 1, 1986
110.608 mln
+85.787 mln
345.63%
jan 1, 1987
74.745 mln
-35.863 mln
-32.42%
jan 1, 1988
99.564 mln
+24.819 mln
33.21%
jan 1, 1989
156.626 mln
+57.062 mln
57.31%
jan 1, 1990
149.691 mln
-6.936 mln
-4.43%
jan 1, 1991
76.572 mln
-73.118 mln
-48.85%
jan 1, 1992
237.715 mln
+161.143 mln
210.44%
jan 1, 1993
350.257 mln
+112.542 mln
47.34%
jan 1, 1994
219.132 mln
-131.126 mln
-37.44%
jan 1, 1995
698.645 mln
+479.513 mln
218.82%
jan 1, 1996
376.052 mln
-322.593 mln
-46.17%
jan 1, 1997
539.607 mln
+163.555 mln
43.49%
jan 1, 1998
368.389 mln
-171.218 mln
-31.73%
jan 1, 1999
293.566 mln
-74.823 mln
-20.31%
jan 1, 2013
1.814 bln
+1.521 bln
518.01%
jan 1, 2014
1.846 bln
+31.882 mln
1.76%
jan 1, 2015
1.409 bln
-437.089 mln
-23.68%
Ranking of countries by current statistics by years


Comments: