29
/
en
AIzaSyAYiBZKx7MnpbEhh9jyipgxe19OcubqV5w
April 1, 2024
272910
Uganda
UGA
true
2
1
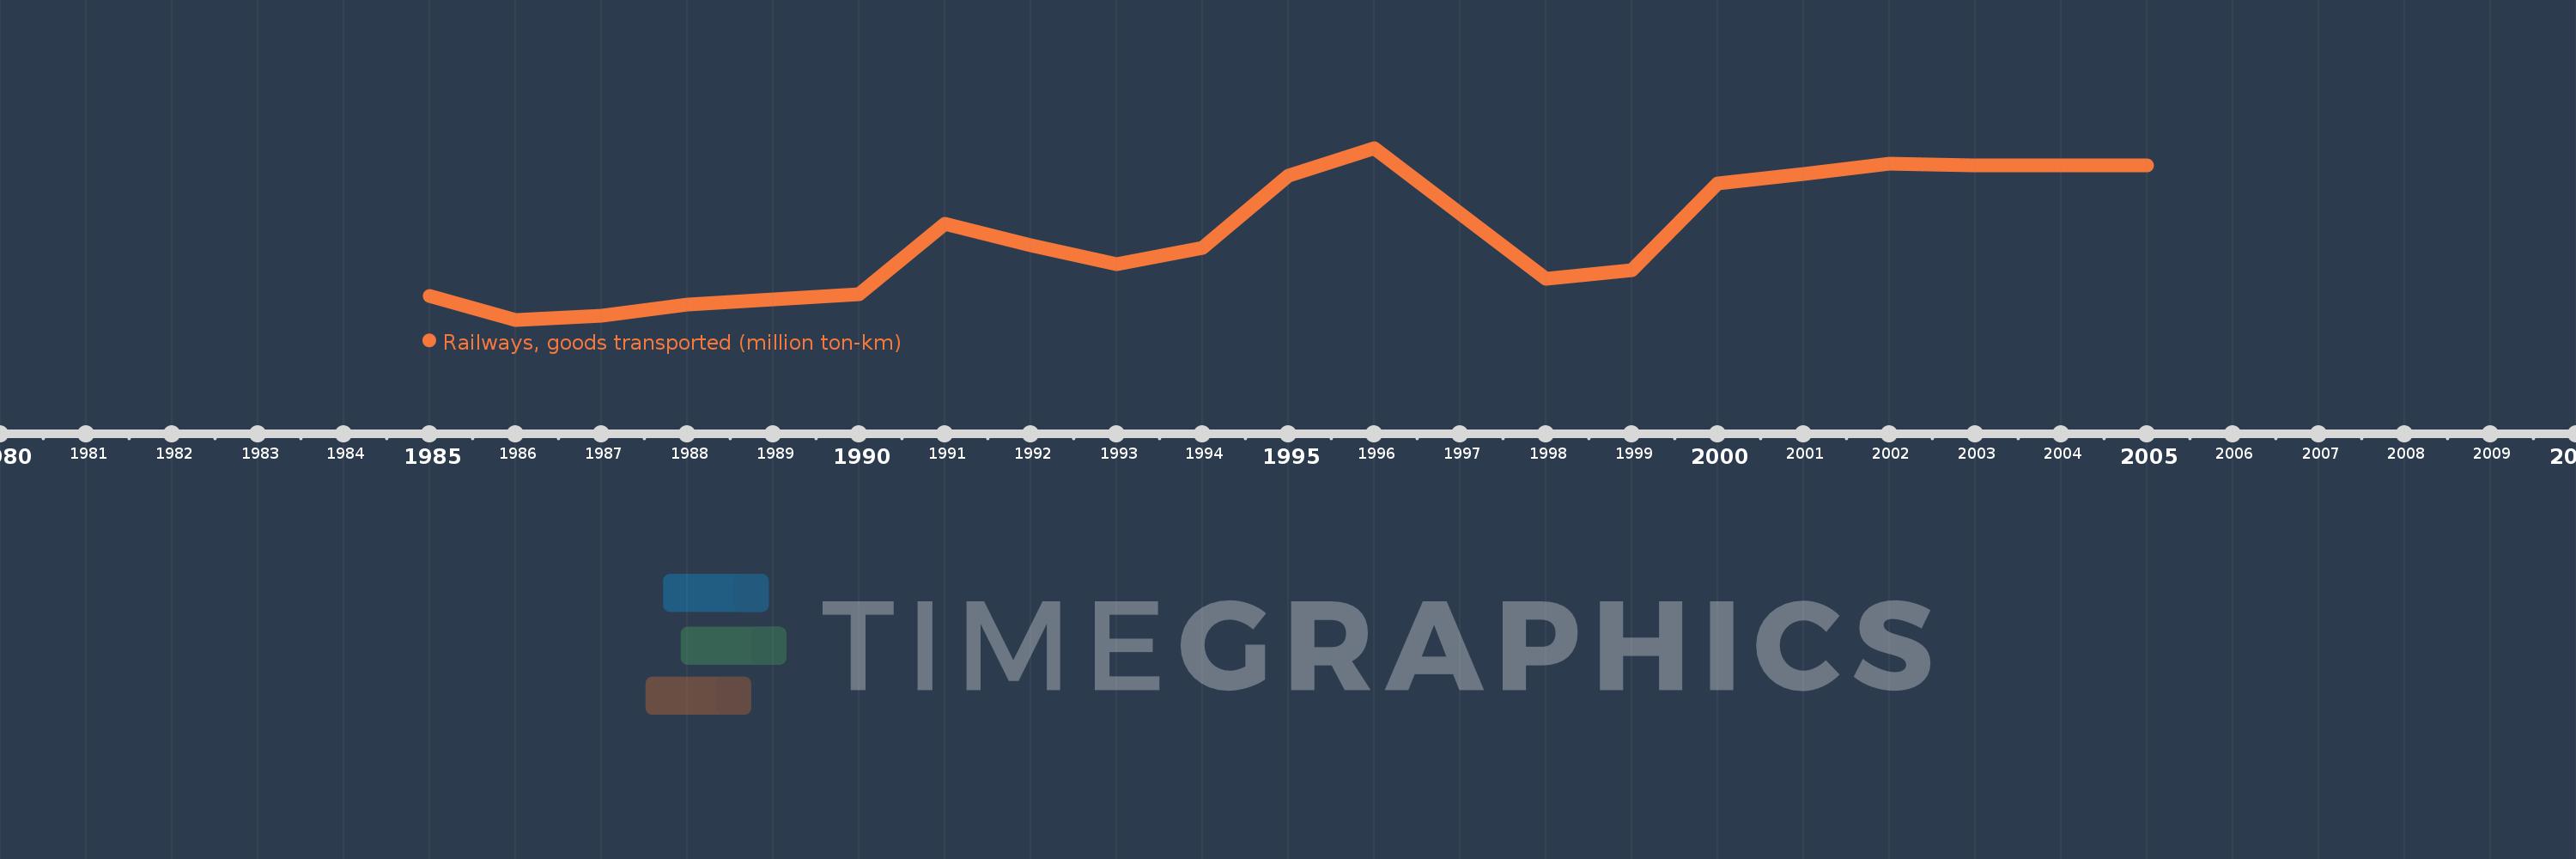
Railways, goods transported (million ton-km)
2005,2003,2002,2001,2000,1999,1998,1996,1995,1994,1993,1992,1991,1990,1989,1988,1987,1986,1985
This statistics in other country:
Timeline:
This timeline shows a graph from 1985 to 2005 of Uganda. No data until 1984. Number of actual observations by date: 19.
Source name:
World Development Indicators
Source organization:
World Bank, Transportation, Water, and Information and Communications Technologies Department, Transport Division.
Categories, topics:
Infrastructure
Last updated:
apr 23, 2017
Indicators value changes by year
Minimum:
62.559
jan 1, 1986
At the date of observation
Value
Absolute change
Change from previous value
jan 1, 1985
86.779
+86.779
0.0%
jan 1, 1986
62.559
-24.22
-27.91%
jan 1, 1987
67.04
+4.481
7.16%
jan 1, 1988
78.04
+11.0
16.41%
jan 1, 1989
82.702
+4.662
5.97%
jan 1, 1990
88.433
+5.731
6.93%
jan 1, 1991
159.0
+70.567
79.8%
jan 1, 1992
138.0
-21.0
-13.21%
jan 1, 1993
119.0
-19.0
-13.77%
jan 1, 1994
135.0
+16.0
13.45%
jan 1, 1995
208.0
+73.0
54.07%
jan 1, 1996
236.0
+28.0
13.46%
jan 1, 1998
104.0
-132.0
-55.93%
jan 1, 1999
112.6
+8.6
8.27%
jan 1, 2000
200.0
+87.4
77.62%
jan 1, 2001
210.0
+10.0
5.0%
jan 1, 2002
220.0
+10.0
4.76%
jan 1, 2003
218.0
-2.0
-0.91%
jan 1, 2005
218.0
0.0
0.0%
Ranking of countries by current statistics by years


Comments: