29
/
en
AIzaSyAYiBZKx7MnpbEhh9jyipgxe19OcubqV5w
April 1, 2024
105401
Chile
CHL
true
2
1
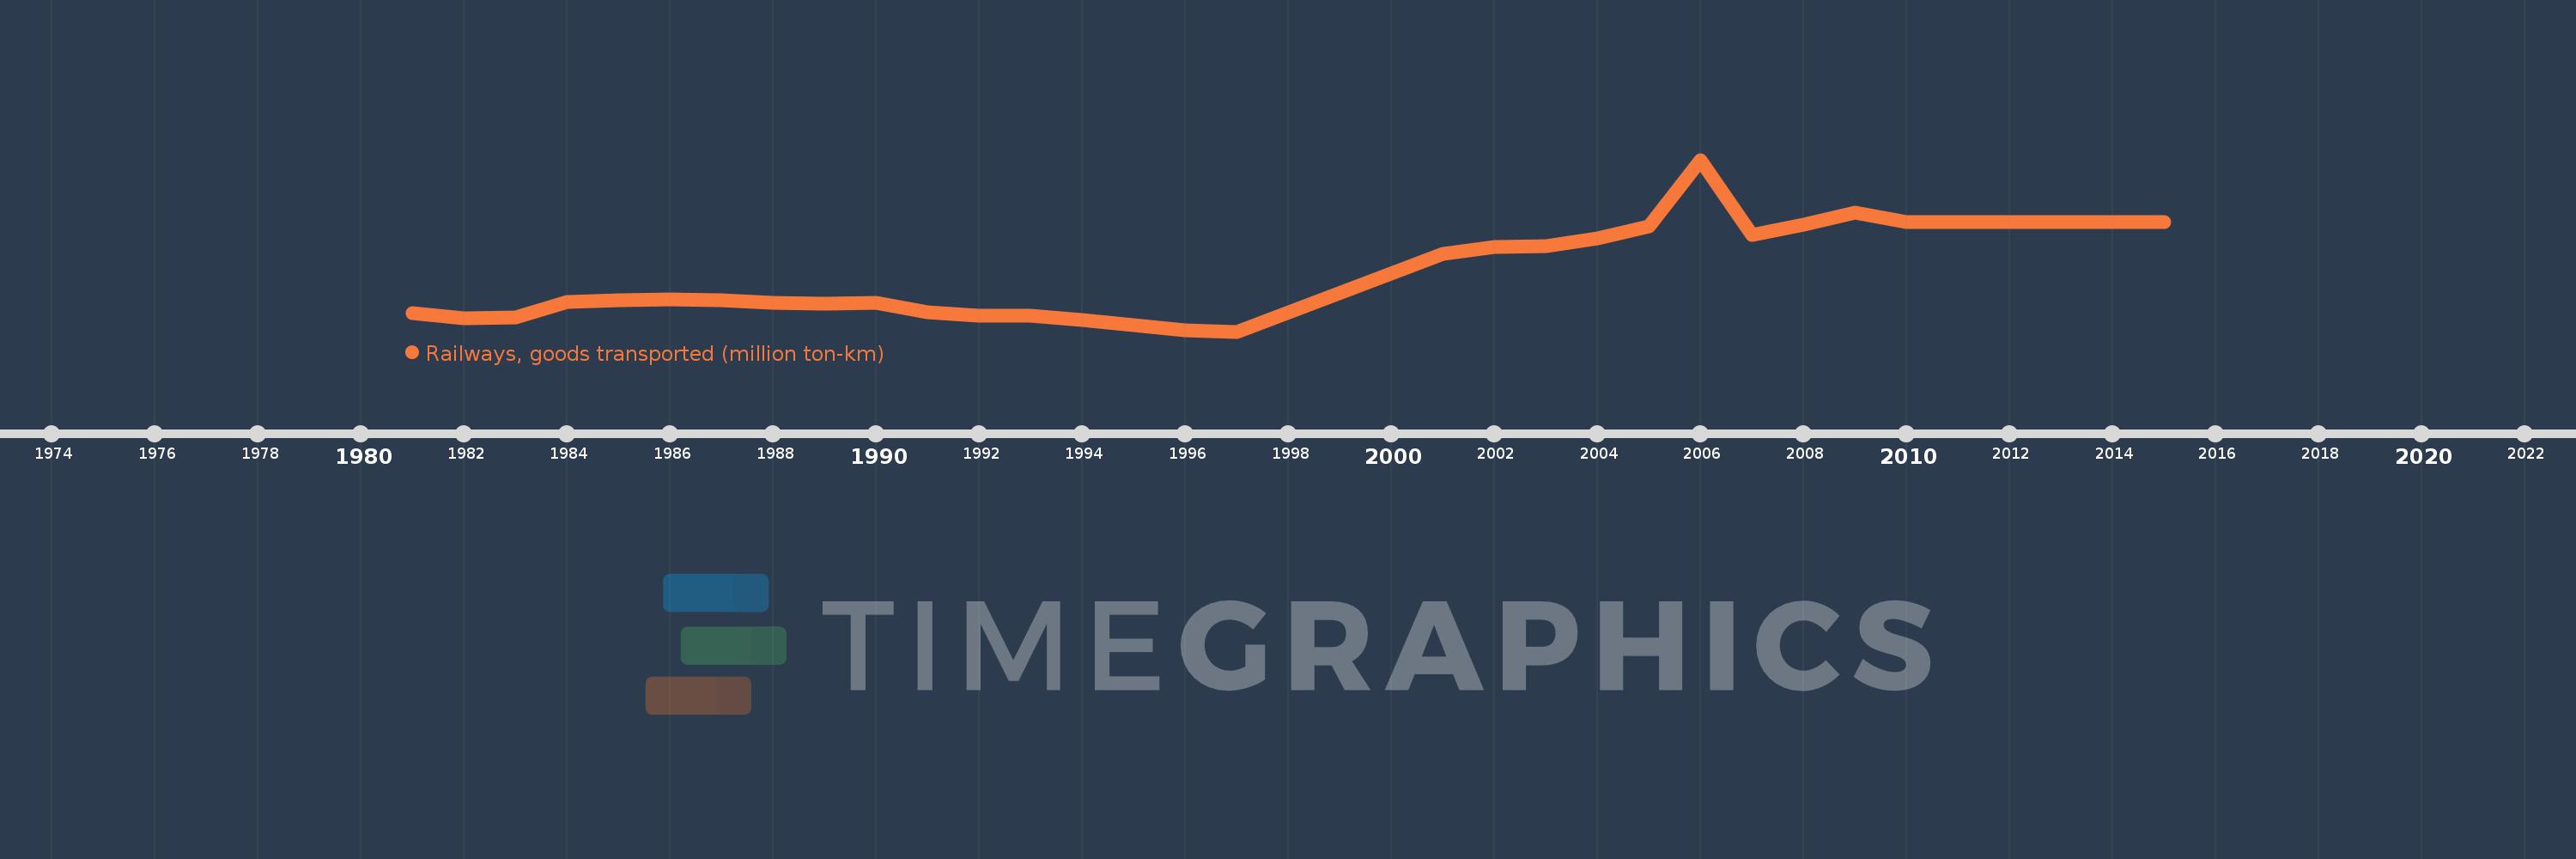
Railways, goods transported (million ton-km)
2015,2014,2013,2012,2011,2010,2009,2008,2007,2006,2005,2004,2003,2002,2001,1997,1996,1995,1994,1993,1992,1991,1990,1989,1988,1987,1986,1985,1984,1983,1982,1981
This statistics in other country:
Timeline:
This timeline shows a graph from 1981 to 2015 of Chile. No data until 1980. Number of actual observations by date: 32.
Source name:
World Development Indicators
Source organization:
World Bank, Transportation, Water, and Information and Communications Technologies Department, Transport Division.
Categories, topics:
Infrastructure
Last updated:
apr 23, 2017
Indicators value changes by year
Maximum:
5.783K
jan 1, 2006
At the date of observation
Value
Absolute change
Change from previous value
jan 1, 1981
1.444K
+1.444K
0.0%
jan 1, 1982
1.299K
-145.0
-10.04%
jan 1, 1983
1.327K
+28.0
2.16%
jan 1, 1984
1.761K
+434.0
32.71%
jan 1, 1985
1.819K
+58.0
3.29%
jan 1, 1986
1.849K
+29.5
1.62%
jan 1, 1987
1.814K
-34.6
-1.87%
jan 1, 1988
1.742K
-71.9
-3.96%
jan 1, 1989
1.712K
-29.595
-1.7%
jan 1, 1990
1.744K
+31.458
1.84%
jan 1, 1991
1.465K
-278.674
-15.98%
jan 1, 1992
1.369K
-95.96
-6.55%
jan 1, 1993
1.372K
+2.488
0.18%
jan 1, 1994
1.265K
-107.151
-7.81%
jan 1, 1995
1.105K
-159.978
-12.65%
jan 1, 1996
967.0
-137.588
-12.46%
jan 1, 1997
931.0
-36.0
-3.72%
jan 1, 2001
3.135K
+2.204K
236.73%
jan 1, 2002
3.318K
+183.0
5.84%
jan 1, 2003
3.338K
+20.0
0.6%
jan 1, 2004
3.575K
+237.0
7.1%
jan 1, 2005
3.898K
+323.0
9.03%
jan 1, 2006
5.783K
+1.885K
48.36%
jan 1, 2007
3.66K
-2.123K
-36.71%
jan 1, 2008
3.957K
+297.0
8.11%
jan 1, 2009
4.296K
+339.0
8.57%
jan 1, 2010
4.032K
-264.0
-6.15%
jan 1, 2011
4.032K
0.0
0.0%
jan 1, 2012
4.032K
0.0
0.0%
jan 1, 2013
4.032K
0.0
0.0%
jan 1, 2014
4.032K
0.0
0.0%
jan 1, 2015
4.032K
0.0
0.0%
Ranking of countries by current statistics by years


Comments: