29
/
en
AIzaSyAYiBZKx7MnpbEhh9jyipgxe19OcubqV5w
April 1, 2024
107933
Colombia
COL
true
2
1
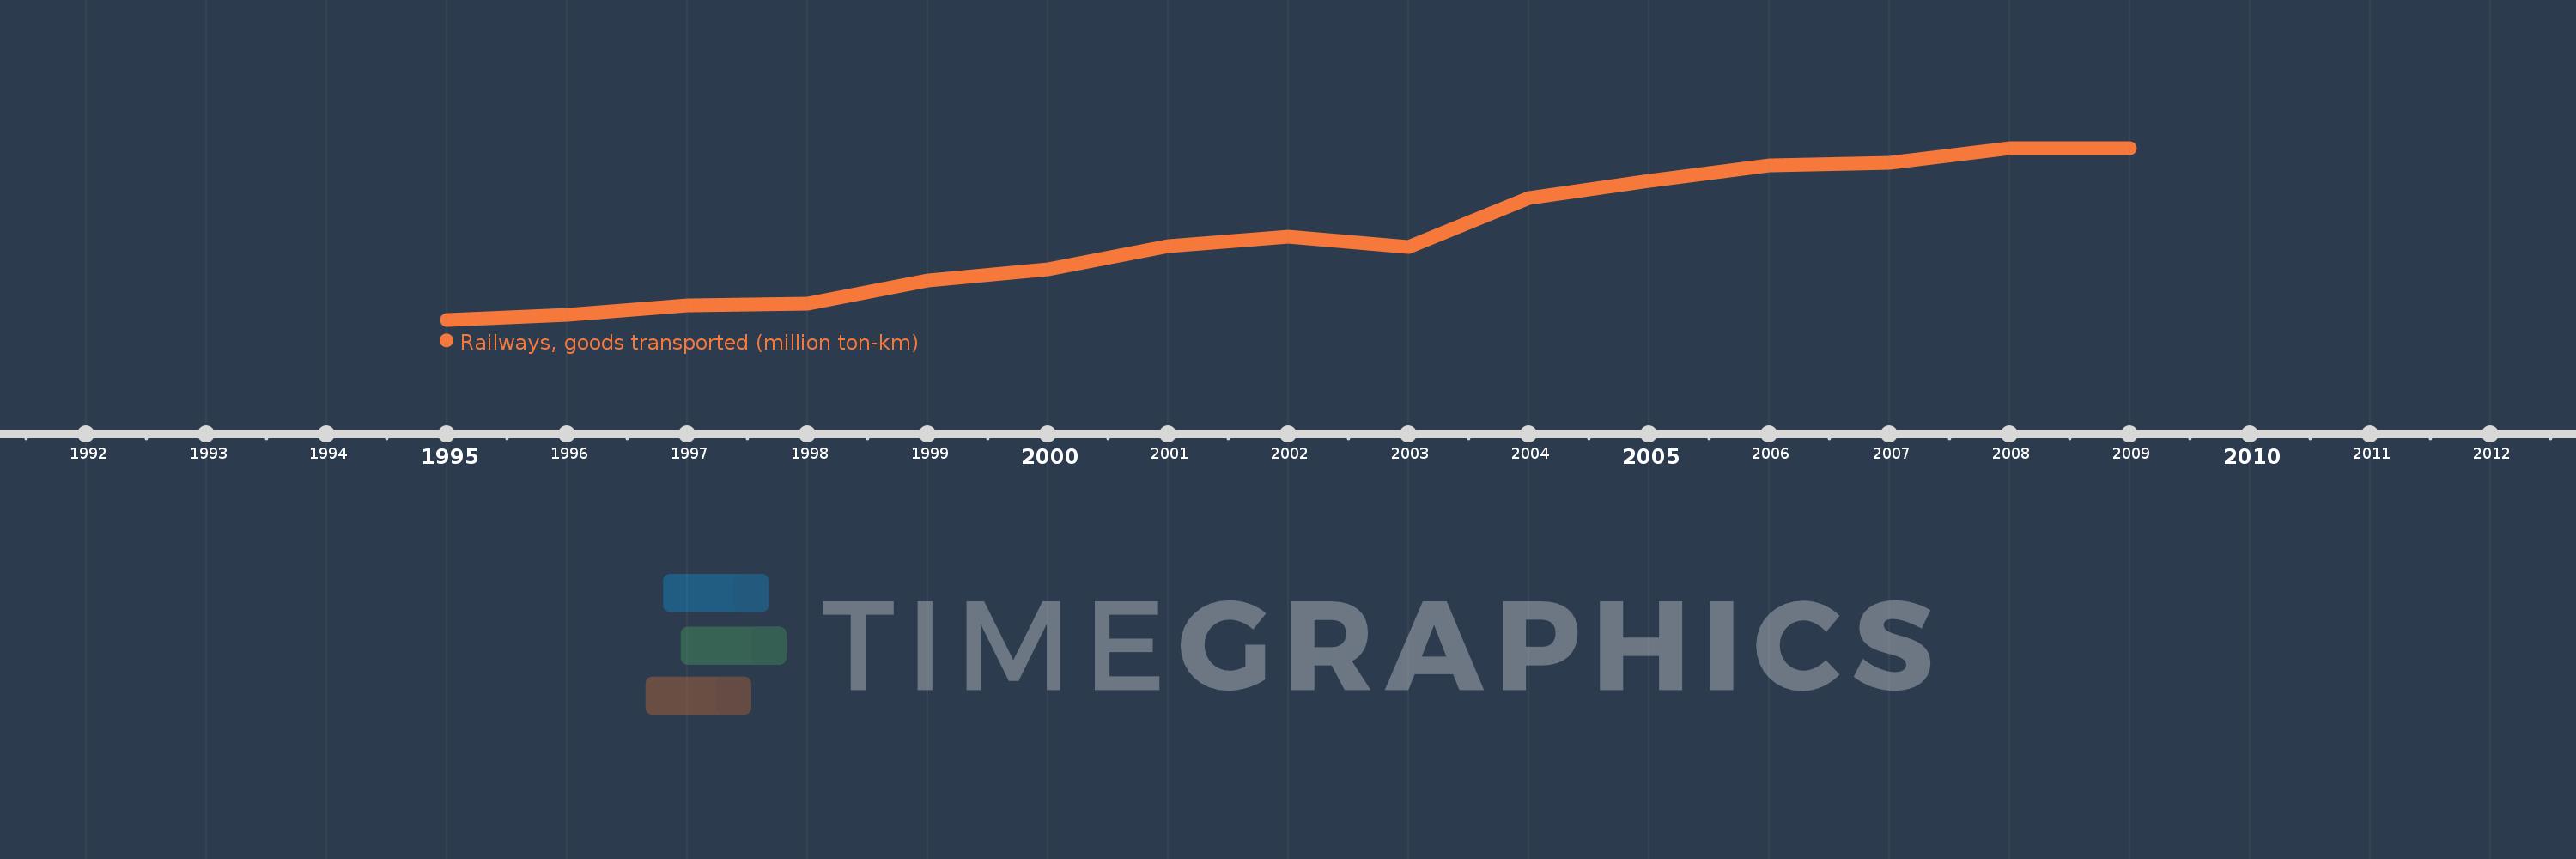
Railways, goods transported (million ton-km)
2009,2008,2007,2006,2005,2004,2003,2002,2001,2000,1999,1998,1997,1996,1995
This statistics in other country:
Timeline:
This timeline shows a graph from 1995 to 2009 of Colombia. No data until 1994. Number of actual observations by date: 15.
Source name:
World Development Indicators
Source organization:
World Bank, Transportation, Water, and Information and Communications Technologies Department, Transport Division.
Categories, topics:
Infrastructure
Last updated:
apr 23, 2017
Indicators value changes by year
Minimum:
2.216K
jan 1, 1995
Maximum:
9.049K
jan 1, 2008
At the date of observation
Value
Absolute change
Change from previous value
jan 1, 1995
2.216K
+2.216K
0.0%
jan 1, 1996
2.423K
+207.0
9.34%
jan 1, 1997
2.795K
+372.0
15.35%
jan 1, 1998
2.866K
+71.0
2.54%
jan 1, 1999
3.791K
+925.0
32.27%
jan 1, 2000
4.208K
+417.0
11.0%
jan 1, 2001
5.146K
+938.0
22.29%
jan 1, 2002
5.52K
+374.0
7.27%
jan 1, 2003
5.12K
-400.0
-7.25%
jan 1, 2004
7.053K
+1.933K
37.75%
jan 1, 2005
7.751K
+698.0
9.9%
jan 1, 2006
8.366K
+615.0
7.93%
jan 1, 2007
8.449K
+83.0
0.99%
jan 1, 2008
9.049K
+600.0
7.1%
jan 1, 2009
9.049K
0.0
0.0%
Ranking of countries by current statistics by years


Comments: