29
/
en
AIzaSyAYiBZKx7MnpbEhh9jyipgxe19OcubqV5w
April 1, 2024
49551
Middle East & North Africa (excluding high income)
MNA
false
2
1
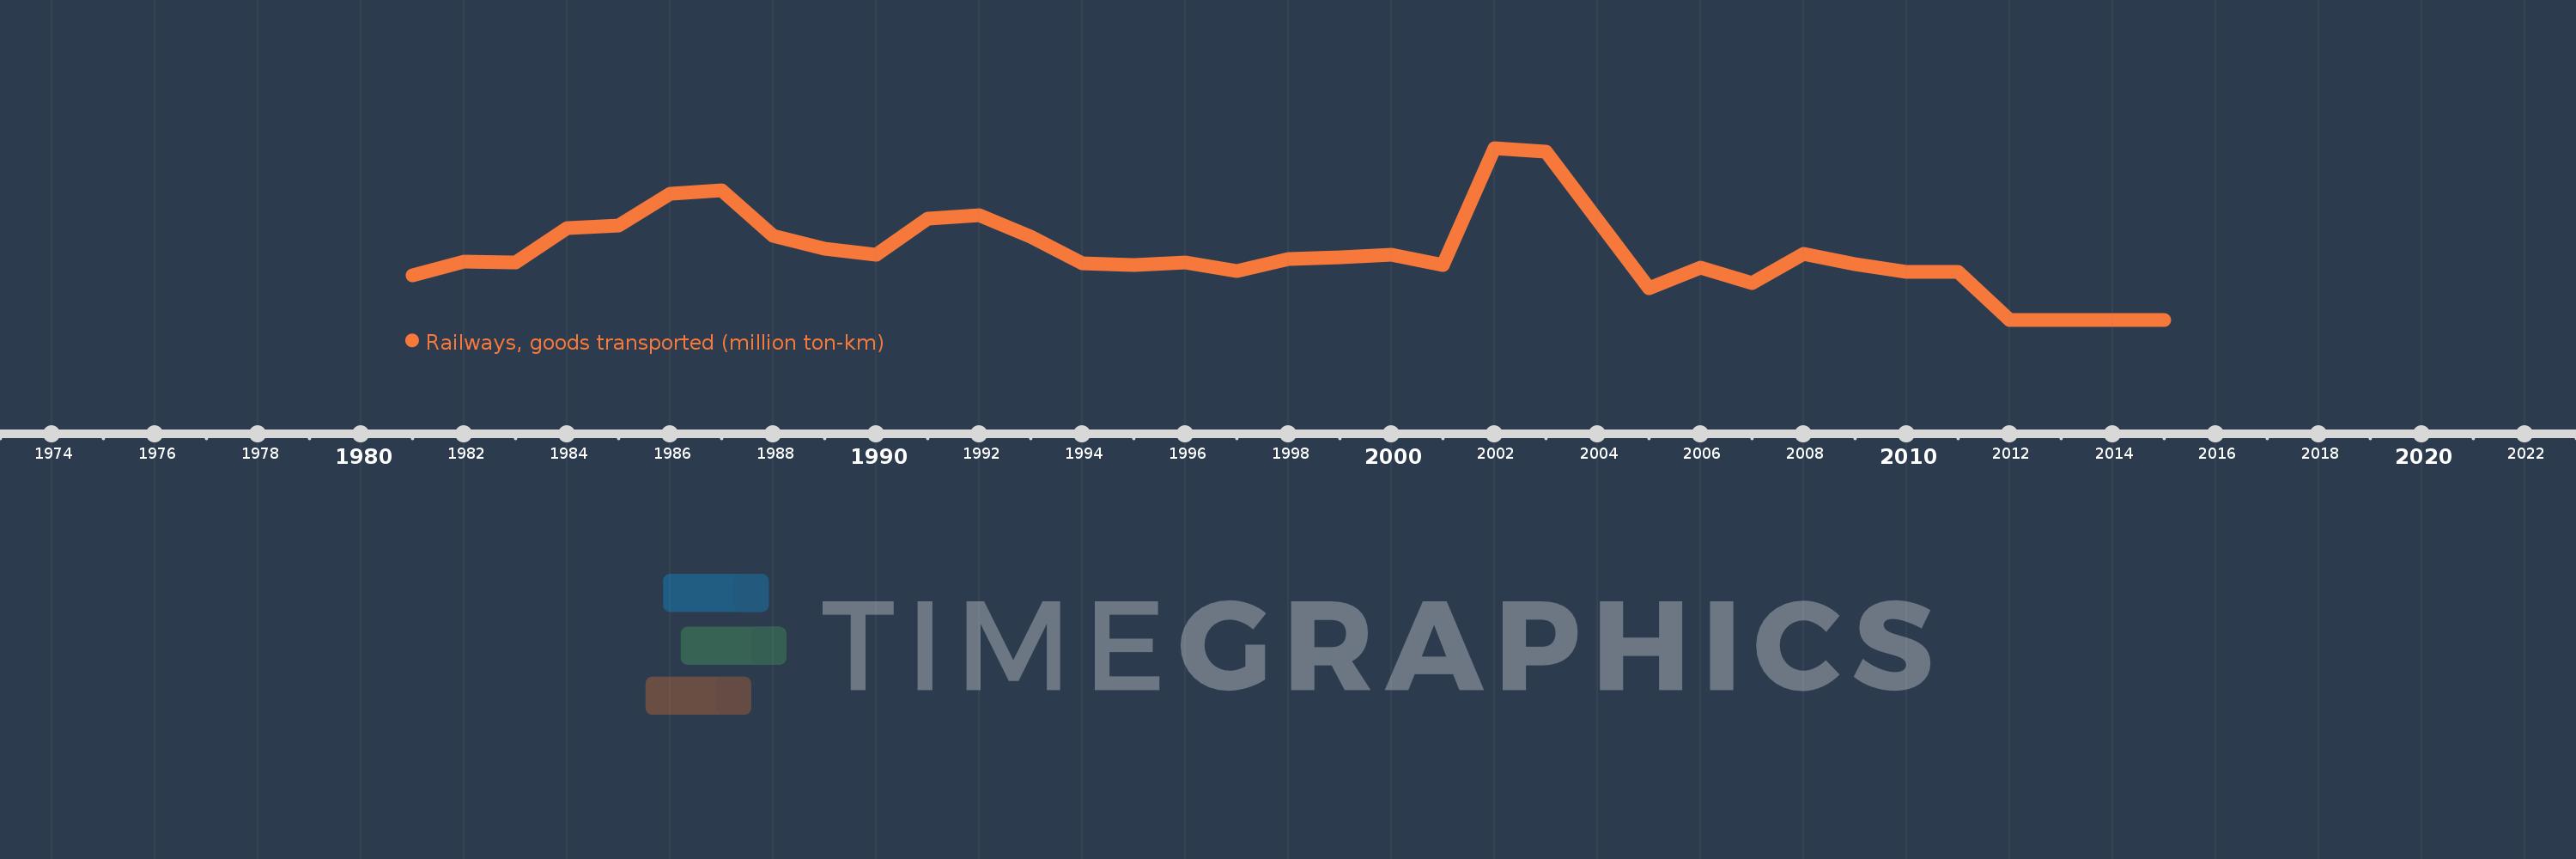
Railways, goods transported (million ton-km)
2015,2014,2013,2012,2011,2010,2009,2008,2007,2006,2005,2003,2002,2001,2000,1999,1998,1997,1996,1995,1994,1993,1992,1991,1990,1989,1988,1987,1986,1985,1984,1983,1982,1981
This statistics in other country:
Timeline:
This timeline shows a graph from 1981 to 2015 of Middle East & North Africa (excluding high income). No data until 1980. Number of actual observations by date: 34.
Source name:
World Development Indicators
Source organization:
World Bank, Transportation, Water, and Information and Communications Technologies Department, Transport Division.
Categories, topics:
Infrastructure
Last updated:
apr 23, 2017
Indicators value changes by year
Minimum:
1.808K
jan 1, 2012
Maximum:
3.286K
jan 1, 2002
At the date of observation
Value
Absolute change
Change from previous value
jan 1, 1981
2.19K
+2.19K
0.0%
jan 1, 1982
2.307K
+117.0
5.34%
jan 1, 1983
2.304K
-3.0
-0.13%
jan 1, 1984
2.597K
+293.0
12.72%
jan 1, 1985
2.621K
+24.0
0.92%
jan 1, 1986
2.892K
+271.0
10.34%
jan 1, 1987
2.925K
+33.0
1.14%
jan 1, 1988
2.533K
-392.5
-13.42%
jan 1, 1989
2.421K
-112.0
-4.42%
jan 1, 1990
2.365K
-55.0
-2.27%
jan 1, 1991
2.68K
+314.5
13.3%
jan 1, 1992
2.704K
+24.0
0.9%
jan 1, 1993
2.522K
-182.0
-6.73%
jan 1, 1994
2.296K
-226.0
-8.96%
jan 1, 1995
2.279K
-17.0
-0.74%
jan 1, 1996
2.302K
+23.0
1.01%
jan 1, 1997
2.224K
-78.0
-3.39%
jan 1, 1998
2.328K
+104.0
4.68%
jan 1, 1999
2.347K
+19.0
0.82%
jan 1, 2000
2.364K
+17.0
0.72%
jan 1, 2001
2.282K
-82.0
-3.47%
jan 1, 2002
3.286K
+1.004K
44.0%
jan 1, 2003
3.253K
-33.0
-1.0%
jan 1, 2005
2.082K
-1.171K
-36.0%
jan 1, 2006
2.258K
+176.0
8.45%
jan 1, 2007
2.124K
-133.8
-5.93%
jan 1, 2008
2.375K
+250.5
11.79%
jan 1, 2009
2.284K
-91.2
-3.84%
jan 1, 2010
2.221K
-62.0
-2.72%
jan 1, 2011
2.221K
0.0
0.0%
jan 1, 2012
1.808K
-413.5
-18.61%
jan 1, 2013
1.808K
0.0
0.0%
jan 1, 2014
1.808K
+0.309
0.02%
jan 1, 2015
1.808K
-0.309
-0.02%
Ranking of countries by current statistics by years


Comments: