29
/
en
AIzaSyAYiBZKx7MnpbEhh9jyipgxe19OcubqV5w
April 1, 2024
204682
Myanmar
MMR
true
2
1
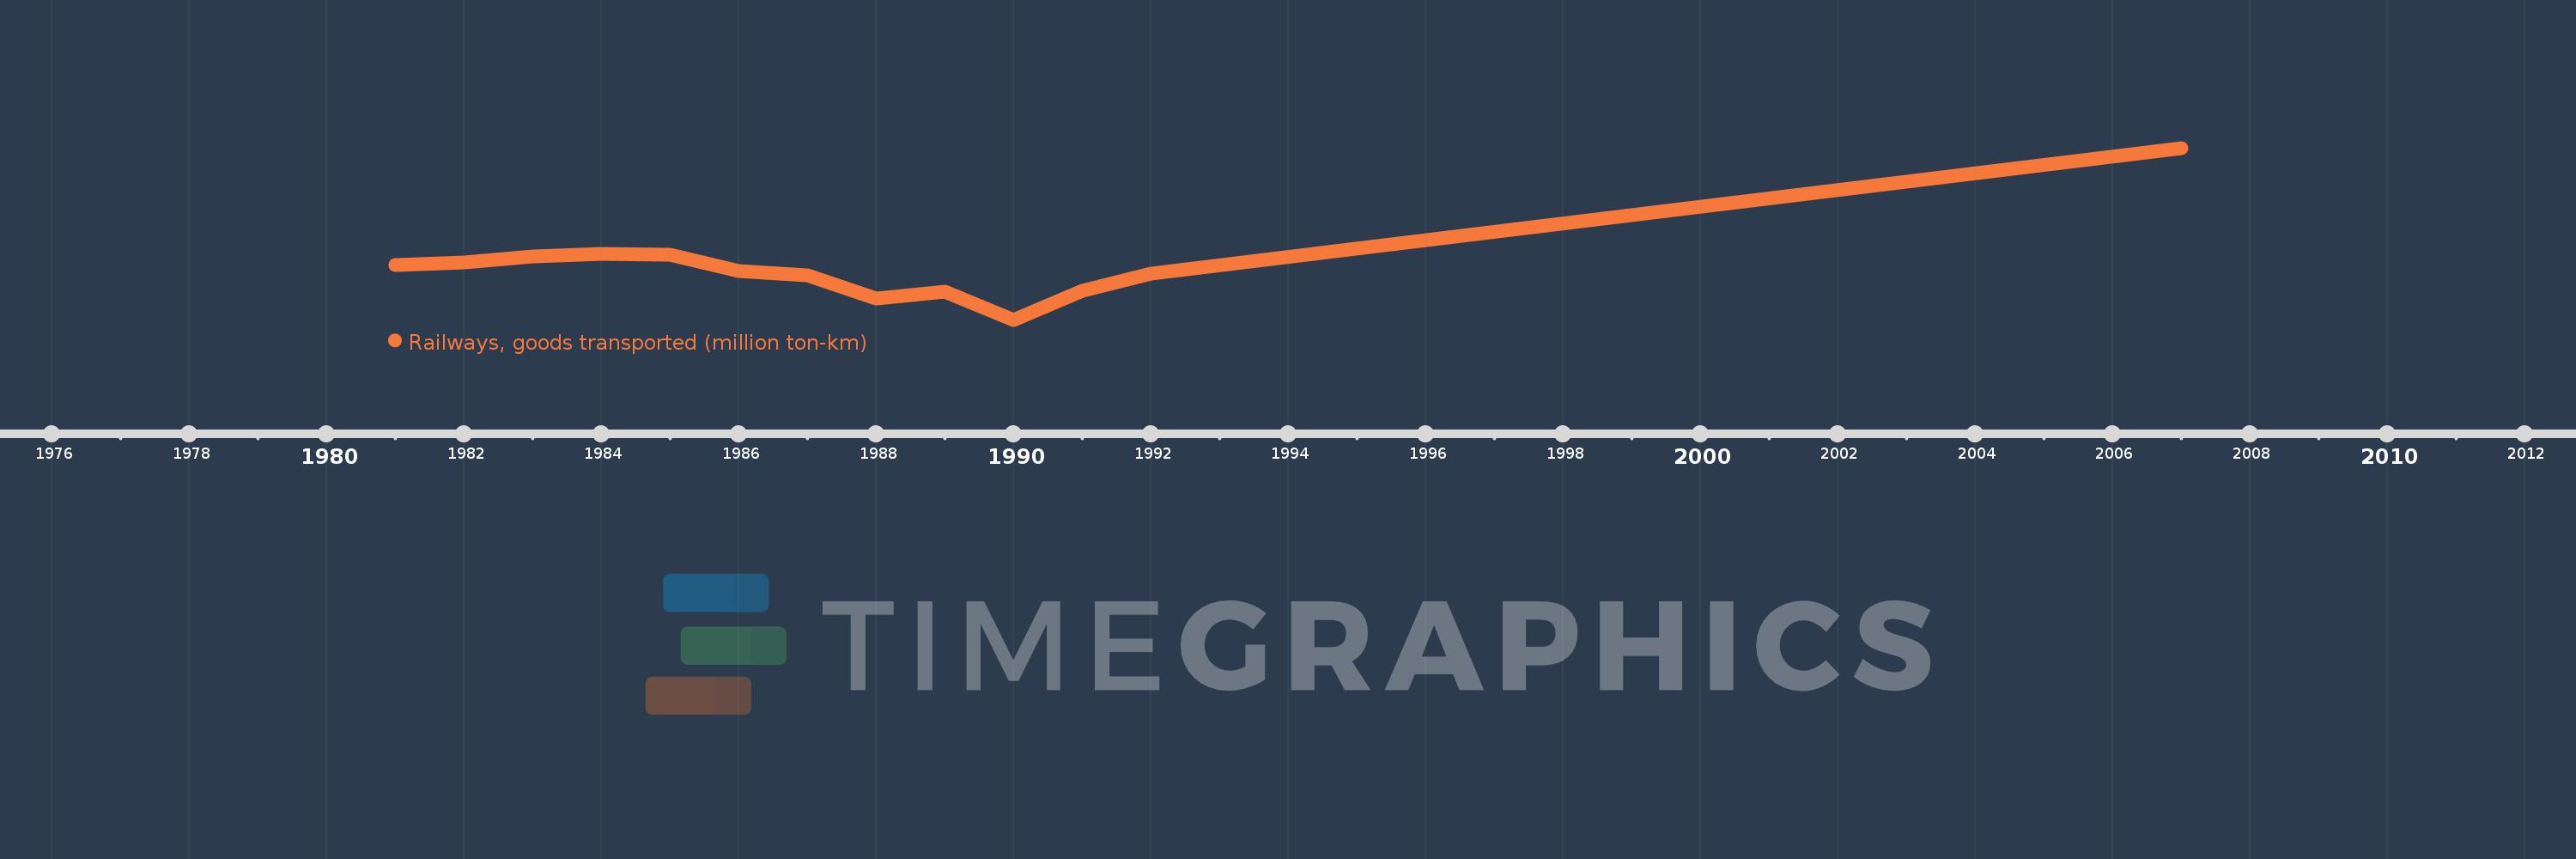
Railways, goods transported (million ton-km)
2007,1992,1991,1990,1989,1988,1987,1986,1985,1984,1983,1982,1981
This statistics in other country:
Timeline:
This timeline shows a graph from 1981 to 2007 of Myanmar. No data until 1980. Number of actual observations by date: 13.
Source name:
World Development Indicators
Source organization:
World Bank, Transportation, Water, and Information and Communications Technologies Department, Transport Division.
Categories, topics:
Infrastructure
Last updated:
apr 23, 2017
Indicators value changes by year
Minimum:
287.747
jan 1, 1990
At the date of observation
Value
Absolute change
Change from previous value
jan 1, 1981
477.87
+477.87
0.0%
jan 1, 1982
487.823
+9.953
2.08%
jan 1, 1983
508.313
+20.491
4.2%
jan 1, 1984
516.949
+8.635
1.7%
jan 1, 1985
512.704
-4.244
-0.82%
jan 1, 1986
458.258
-54.446
-10.62%
jan 1, 1987
442.451
-15.807
-3.45%
jan 1, 1988
362.098
-80.352
-18.16%
jan 1, 1989
386.14
+24.041
6.64%
jan 1, 1990
287.747
-98.393
-25.48%
jan 1, 1991
387.565
+99.819
34.69%
jan 1, 1992
449.183
+61.618
15.9%
jan 1, 2007
885.0
+435.817
97.02%
Ranking of countries by current statistics by years


Comments: