29
/
en
AIzaSyAYiBZKx7MnpbEhh9jyipgxe19OcubqV5w
April 1, 2024
276110
United Kingdom
GBR
true
2
1
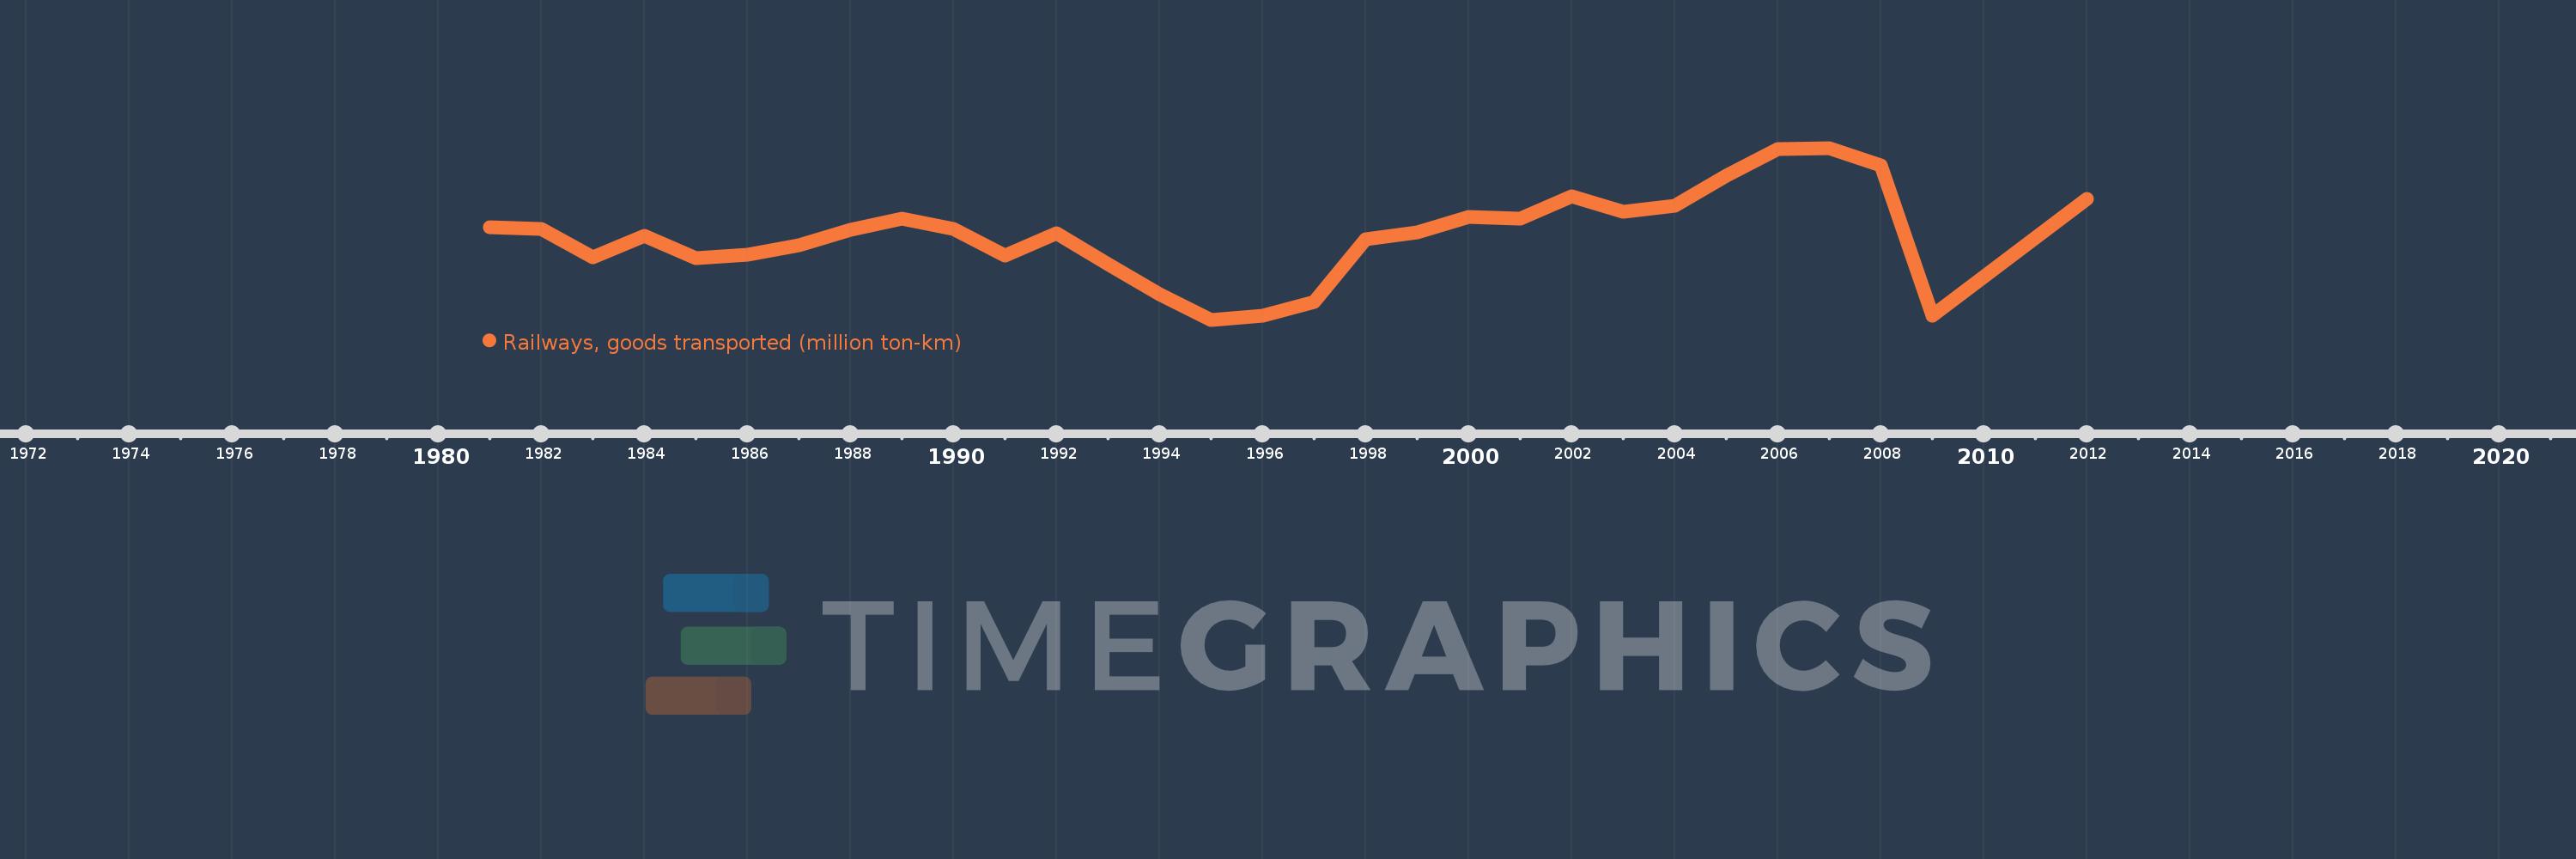
Railways, goods transported (million ton-km)
2012,2009,2008,2007,2006,2005,2004,2003,2002,2001,2000,1999,1998,1997,1996,1995,1994,1993,1992,1991,1990,1989,1988,1987,1986,1985,1984,1983,1982,1981
This statistics in other country:
Timeline:
This timeline shows a graph from 1981 to 2012 of United Kingdom. No data until 1980. Number of actual observations by date: 30.
Source name:
World Development Indicators
Source organization:
World Bank, Transportation, Water, and Information and Communications Technologies Department, Transport Division.
Categories, topics:
Infrastructure
Last updated:
apr 23, 2017
Indicators value changes by year
Minimum:
12.292K
jan 1, 1995
Maximum:
22.18K
jan 1, 2007
At the date of observation
Value
Absolute change
Change from previous value
jan 1, 1981
17.64K
+17.64K
0.0%
jan 1, 1982
17.505K
-135.0
-0.77%
jan 1, 1983
15.879K
-1.626K
-9.29%
jan 1, 1984
17.144K
+1.265K
7.97%
jan 1, 1985
15.842K
-1.302K
-7.59%
jan 1, 1986
16.047K
+205.0
1.29%
jan 1, 1987
16.565K
+518.0
3.23%
jan 1, 1988
17.466K
+901.0
5.44%
jan 1, 1989
18.104K
+638.0
3.65%
jan 1, 1990
17.532K
-572.0
-3.16%
jan 1, 1991
15.986K
-1.546K
-8.82%
jan 1, 1992
17.274K
+1.288K
8.06%
jan 1, 1993
15.509K
-1.765K
-10.22%
jan 1, 1994
13.765K
-1.744K
-11.25%
jan 1, 1995
12.292K
-1.473K
-10.7%
jan 1, 1996
12.537K
+245.0
1.99%
jan 1, 1997
13.3K
+763.0
6.09%
jan 1, 1998
16.9K
+3.6K
27.07%
jan 1, 1999
17.34K
+440.0
2.6%
jan 1, 2000
18.23K
+890.0
5.13%
jan 1, 2001
18.09K
-140.0
-0.77%
jan 1, 2002
19.39K
+1.3K
7.19%
jan 1, 2003
18.52K
-870.0
-4.49%
jan 1, 2004
18.87K
+350.0
1.89%
jan 1, 2005
20.57K
+1.7K
9.01%
jan 1, 2006
22.11K
+1.54K
7.49%
jan 1, 2007
22.18K
+70.0
0.32%
jan 1, 2008
21.2K
-980.0
-4.42%
jan 1, 2009
12.512K
-8.688K
-40.98%
jan 1, 2012
19.23K
+6.718K
53.69%
Ranking of countries by current statistics by years


Comments: