29
/
en
AIzaSyAYiBZKx7MnpbEhh9jyipgxe19OcubqV5w
April 1, 2024
188437
Malaysia
MYS
true
2
1
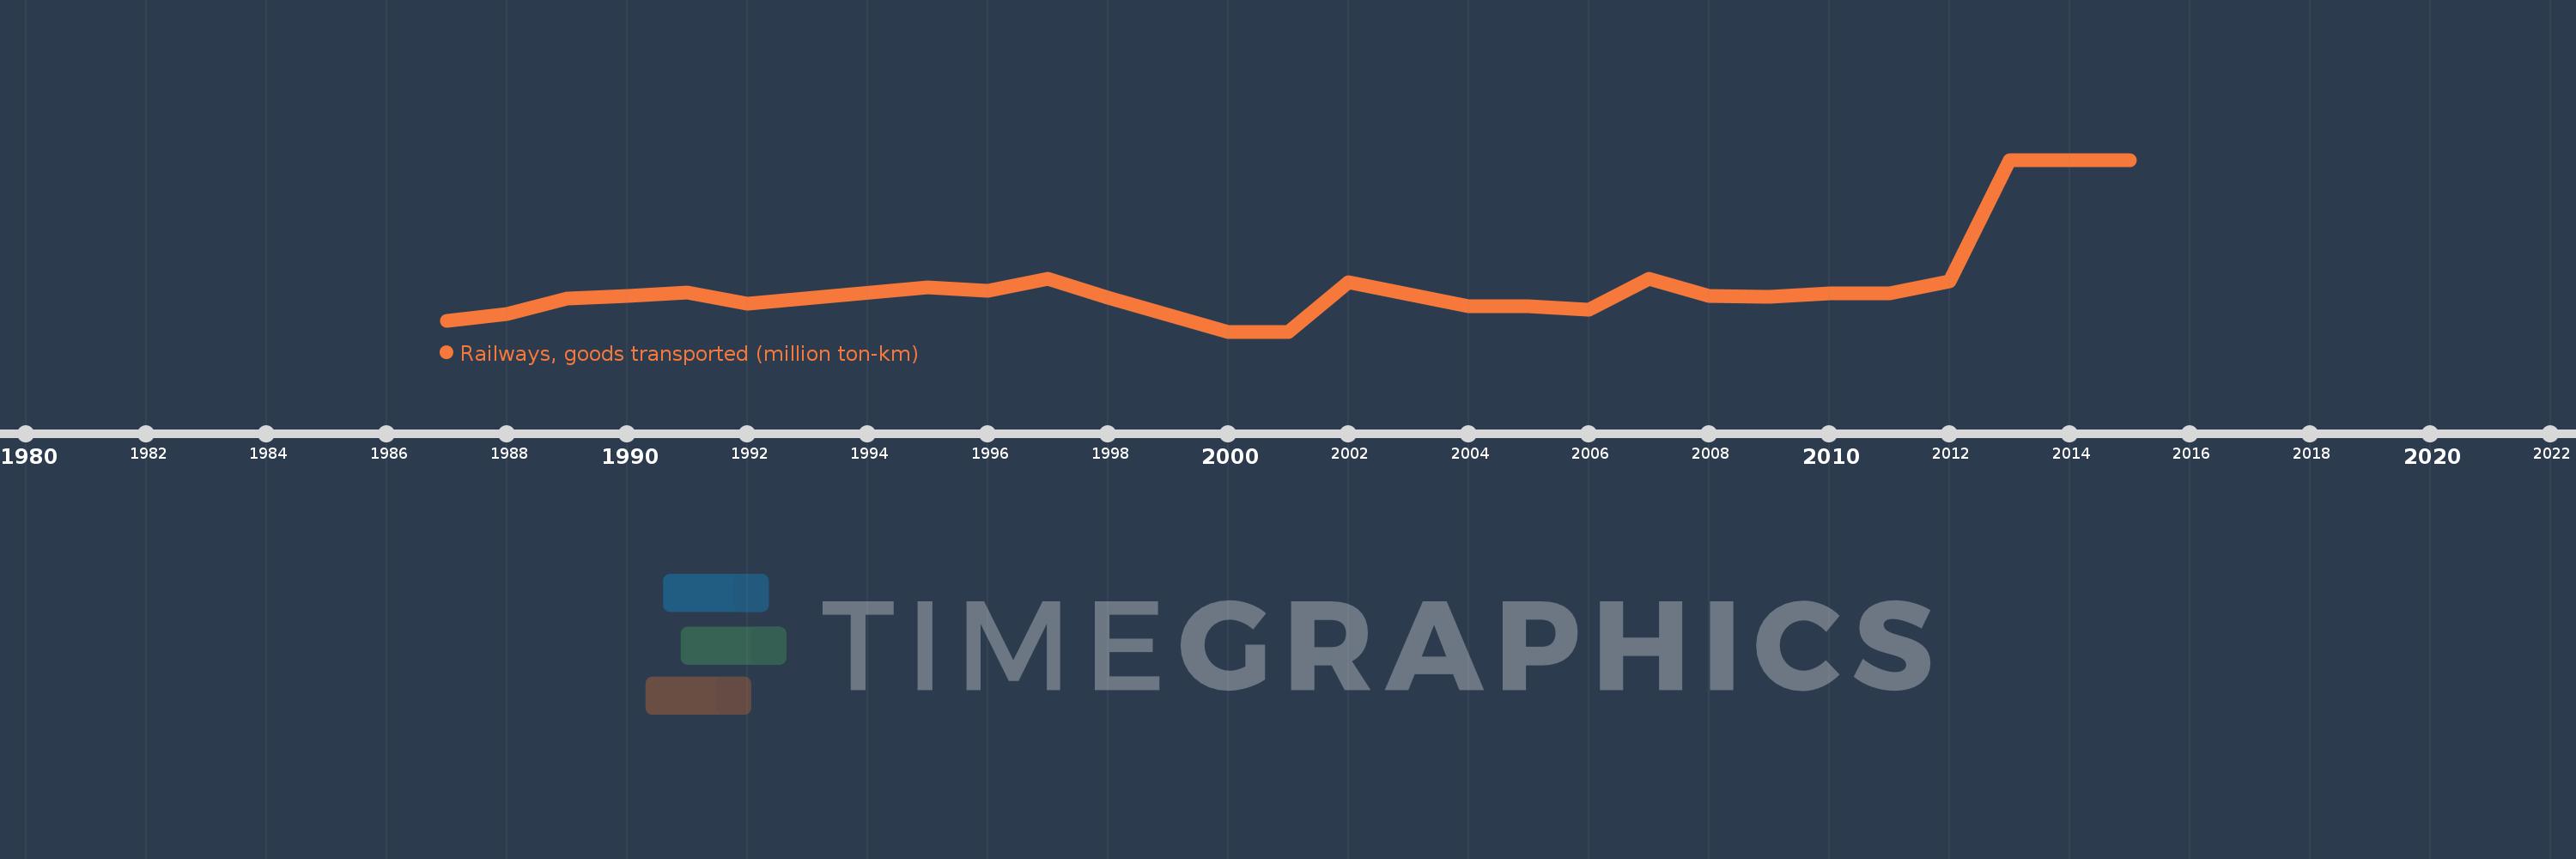
Railways, goods transported (million ton-km)
2015,2014,2013,2012,2011,2010,2009,2008,2007,2006,2005,2004,2002,2001,2000,1998,1997,1996,1995,1992,1991,1990,1989,1988,1987
This statistics in other country:
Timeline:
This timeline shows a graph from 1987 to 2015 of Malaysia. No data until 1986. Number of actual observations by date: 25.
Source name:
World Development Indicators
Source organization:
World Bank, Transportation, Water, and Information and Communications Technologies Department, Transport Division.
Categories, topics:
Infrastructure
Last updated:
apr 23, 2017
Indicators value changes by year
Maximum:
3.071K
jan 1, 2013
At the date of observation
Value
Absolute change
Change from previous value
jan 1, 1987
1.046K
+1.046K
0.0%
jan 1, 1988
1.124K
+78.89
7.55%
jan 1, 1989
1.326K
+201.936
17.96%
jan 1, 1990
1.361K
+34.731
2.62%
jan 1, 1991
1.404K
+43.301
3.18%
jan 1, 1992
1.262K
-142.438
-10.14%
jan 1, 1995
1.463K
+201.0
15.93%
jan 1, 1996
1.416K
-47.0
-3.21%
jan 1, 1997
1.574K
+158.0
11.16%
jan 1, 1998
1.338K
-236.0
-14.99%
jan 1, 2000
907.0
-431.0
-32.21%
jan 1, 2001
907.0
0.0
0.0%
jan 1, 2002
1.531K
+624.0
68.8%
jan 1, 2004
1.224K
-307.0
-20.05%
jan 1, 2005
1.224K
0.0
0.0%
jan 1, 2006
1.178K
-46.0
-3.76%
jan 1, 2007
1.572K
+394.0
33.45%
jan 1, 2008
1.355K
-217.0
-13.8%
jan 1, 2009
1.35K
-5.0
-0.37%
jan 1, 2010
1.384K
+34.0
2.52%
jan 1, 2011
1.384K
0.0
0.0%
jan 1, 2012
1.535K
+151.0
10.91%
jan 1, 2013
3.071K
+1.536K
100.07%
jan 1, 2014
3.071K
0.0
0.0%
jan 1, 2015
3.071K
0.0
0.0%
Ranking of countries by current statistics by years


Comments: