29
/
en
AIzaSyAYiBZKx7MnpbEhh9jyipgxe19OcubqV5w
April 1, 2024
272888
Uganda
UGA
true
2
1
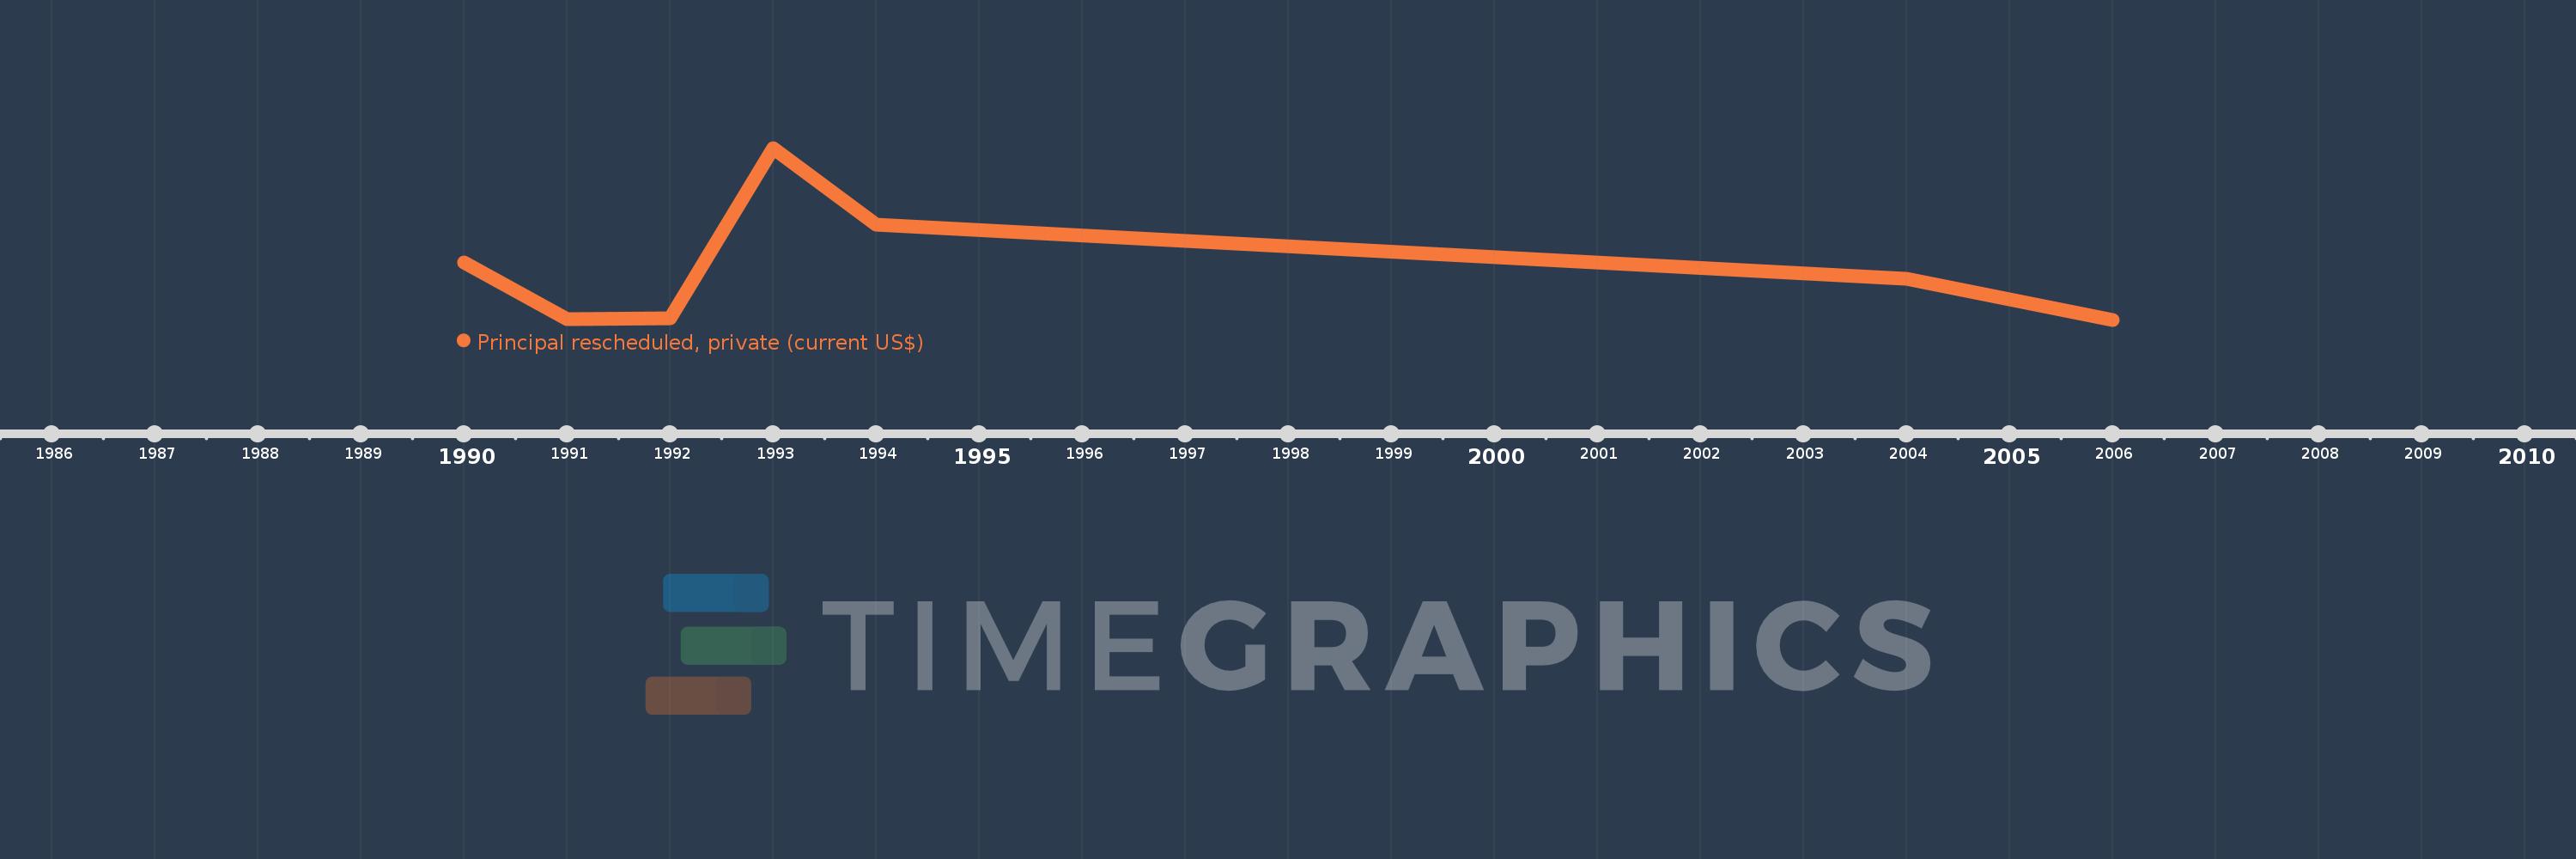
Principal rescheduled, private (current US$)
2006,2004,1994,1993,1992,1991,1990
This statistics in other country:
Timeline:
This timeline shows a graph from 1990 to 2006 of Uganda. No data until 1989. Number of actual observations by date: 7.
Source name:
World Development Indicators
Source organization:
World Bank, International Debt Statistics.
Categories, topics:
External Debt
Last updated:
apr 23, 2017
Indicators value changes by year
Maximum:
24.241 mln
jan 1, 1993
At the date of observation
Value
Absolute change
Change from previous value
jan 1, 1990
8.126 mln
+8.126 mln
0.0%
jan 1, 1991
104.0K
-8.022 mln
-98.72%
jan 1, 1992
176.0K
+72.0K
69.23%
jan 1, 1993
24.241 mln
+24.065 mln
13.67K%
jan 1, 1994
13.376 mln
-10.865 mln
-44.82%
jan 1, 2004
5.816 mln
-7.56 mln
-56.52%
jan 1, 2006
0.0
-5.816 mln
-100.0%
Ranking of countries by current statistics by years


Comments: