29
/
en
AIzaSyAYiBZKx7MnpbEhh9jyipgxe19OcubqV5w
April 1, 2024
57594
South Asia
SAS
false
2
1
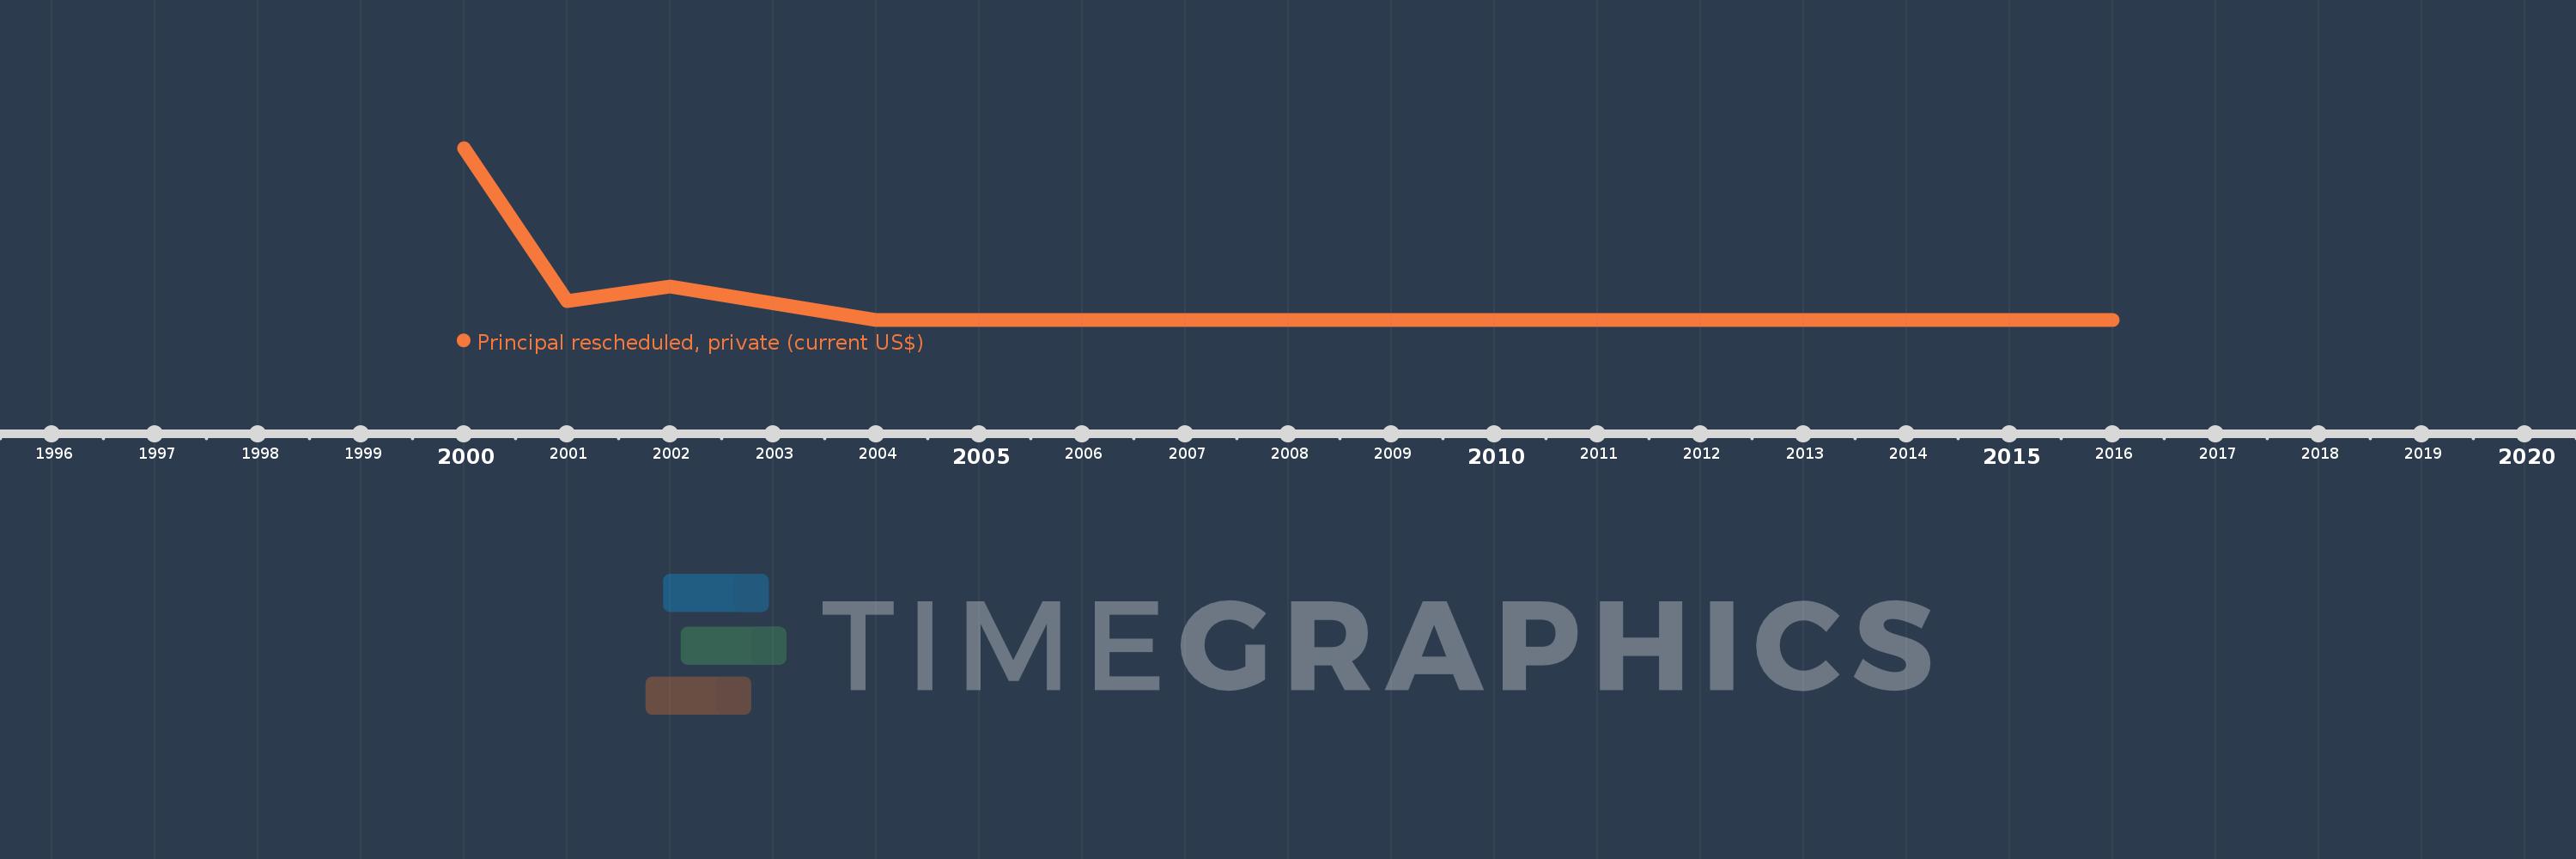
Principal rescheduled, private (current US$)
2016,2015,2014,2011,2010,2008,2007,2006,2005,2004,2002,2001,2000
This statistics in other country:
Timeline:
This timeline shows a graph from 2000 to 2016 of South Asia. No data until 1999. Number of actual observations by date: 13.
Source name:
World Development Indicators
Source organization:
World Bank, International Debt Statistics.
Categories, topics:
External Debt
Last updated:
apr 23, 2017
Indicators value changes by year
Maximum:
705.261 mln
jan 1, 2000
At the date of observation
Value
Absolute change
Change from previous value
jan 1, 2000
705.261 mln
+705.261 mln
0.0%
jan 1, 2001
78.035 mln
-627.226 mln
-88.94%
jan 1, 2002
137.954 mln
+59.919 mln
76.78%
jan 1, 2004
0.0
-137.954 mln
-100.0%
Ranking of countries by current statistics by years


Comments: