29
/
en
AIzaSyAYiBZKx7MnpbEhh9jyipgxe19OcubqV5w
April 1, 2024
68335
Angola
AGO
true
2
1
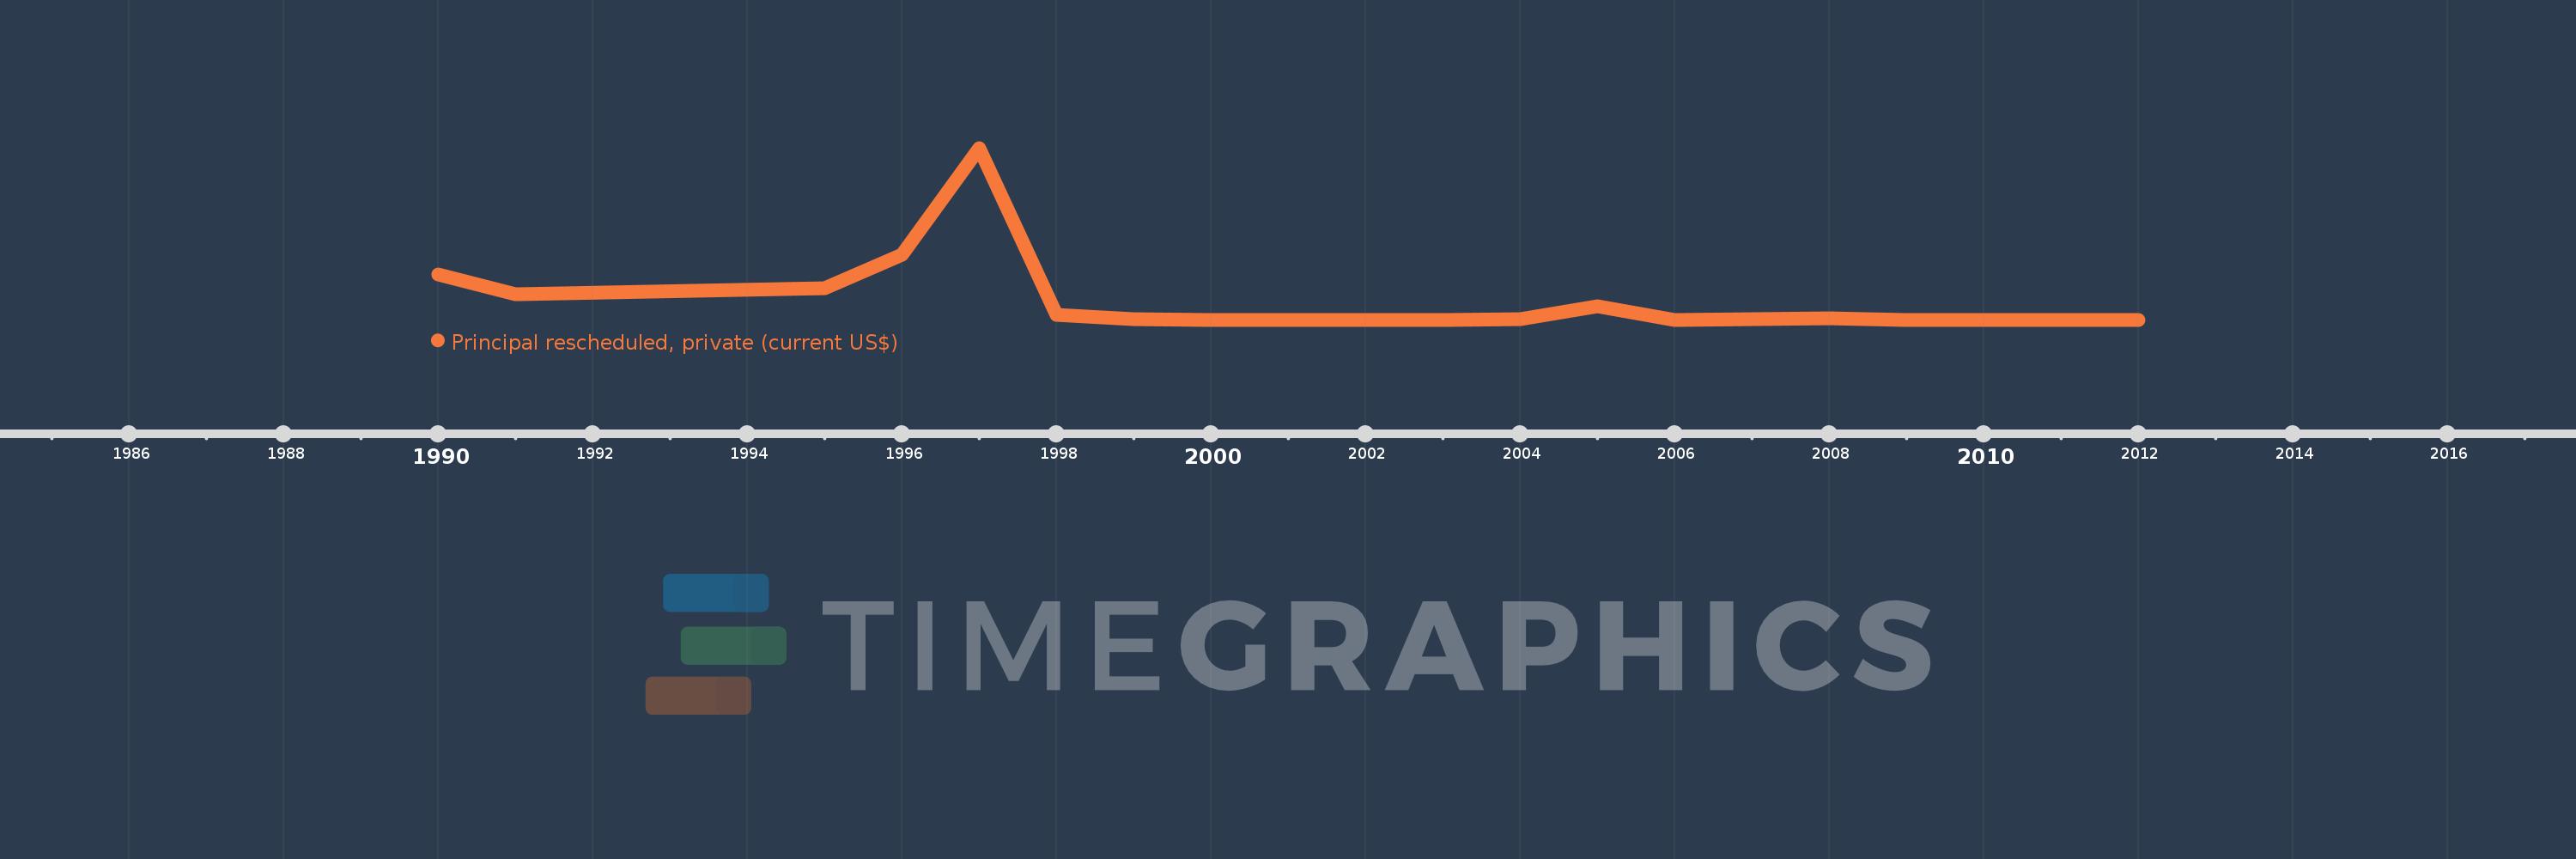
Principal rescheduled, private (current US$)
2012,2010,2009,2008,2007,2006,2005,2004,2003,2002,2001,2000,1999,1998,1997,1996,1995,1991,1990
This statistics in other country:
Timeline:
This timeline shows a graph from 1990 to 2012 of Angola. No data until 1989. Number of actual observations by date: 19.
Source name:
World Development Indicators
Source organization:
World Bank, International Debt Statistics.
Categories, topics:
External Debt
Last updated:
apr 23, 2017
Indicators value changes by year
Maximum:
949.477 mln
jan 1, 1997
At the date of observation
Value
Absolute change
Change from previous value
jan 1, 1990
248.346 mln
+248.346 mln
0.0%
jan 1, 1991
143.328 mln
-105.018 mln
-42.29%
jan 1, 1995
172.096 mln
+28.768 mln
20.07%
jan 1, 1996
359.886 mln
+187.79 mln
109.12%
jan 1, 1997
949.477 mln
+589.591 mln
163.83%
jan 1, 1998
28.202 mln
-921.275 mln
-97.03%
jan 1, 1999
3.256 mln
-24.946 mln
-88.45%
jan 1, 2000
159.0K
-3.097 mln
-95.12%
jan 1, 2001
537.0K
+378.0K
237.74%
jan 1, 2002
56.0K
-481.0K
-89.57%
jan 1, 2003
103.0K
+47.0K
83.93%
jan 1, 2004
3.589 mln
+3.486 mln
3.38K%
jan 1, 2005
74.488 mln
+70.899 mln
1.98K%
jan 1, 2006
0.0
-74.488 mln
-100.0%
jan 1, 2007
1.545 mln
+1.545 mln
%
jan 1, 2008
7.357 mln
+5.812 mln
376.18%
jan 1, 2009
0.0
-7.357 mln
-100.0%
Ranking of countries by current statistics by years


Comments: