Download This statistics in other country:
Timeline:
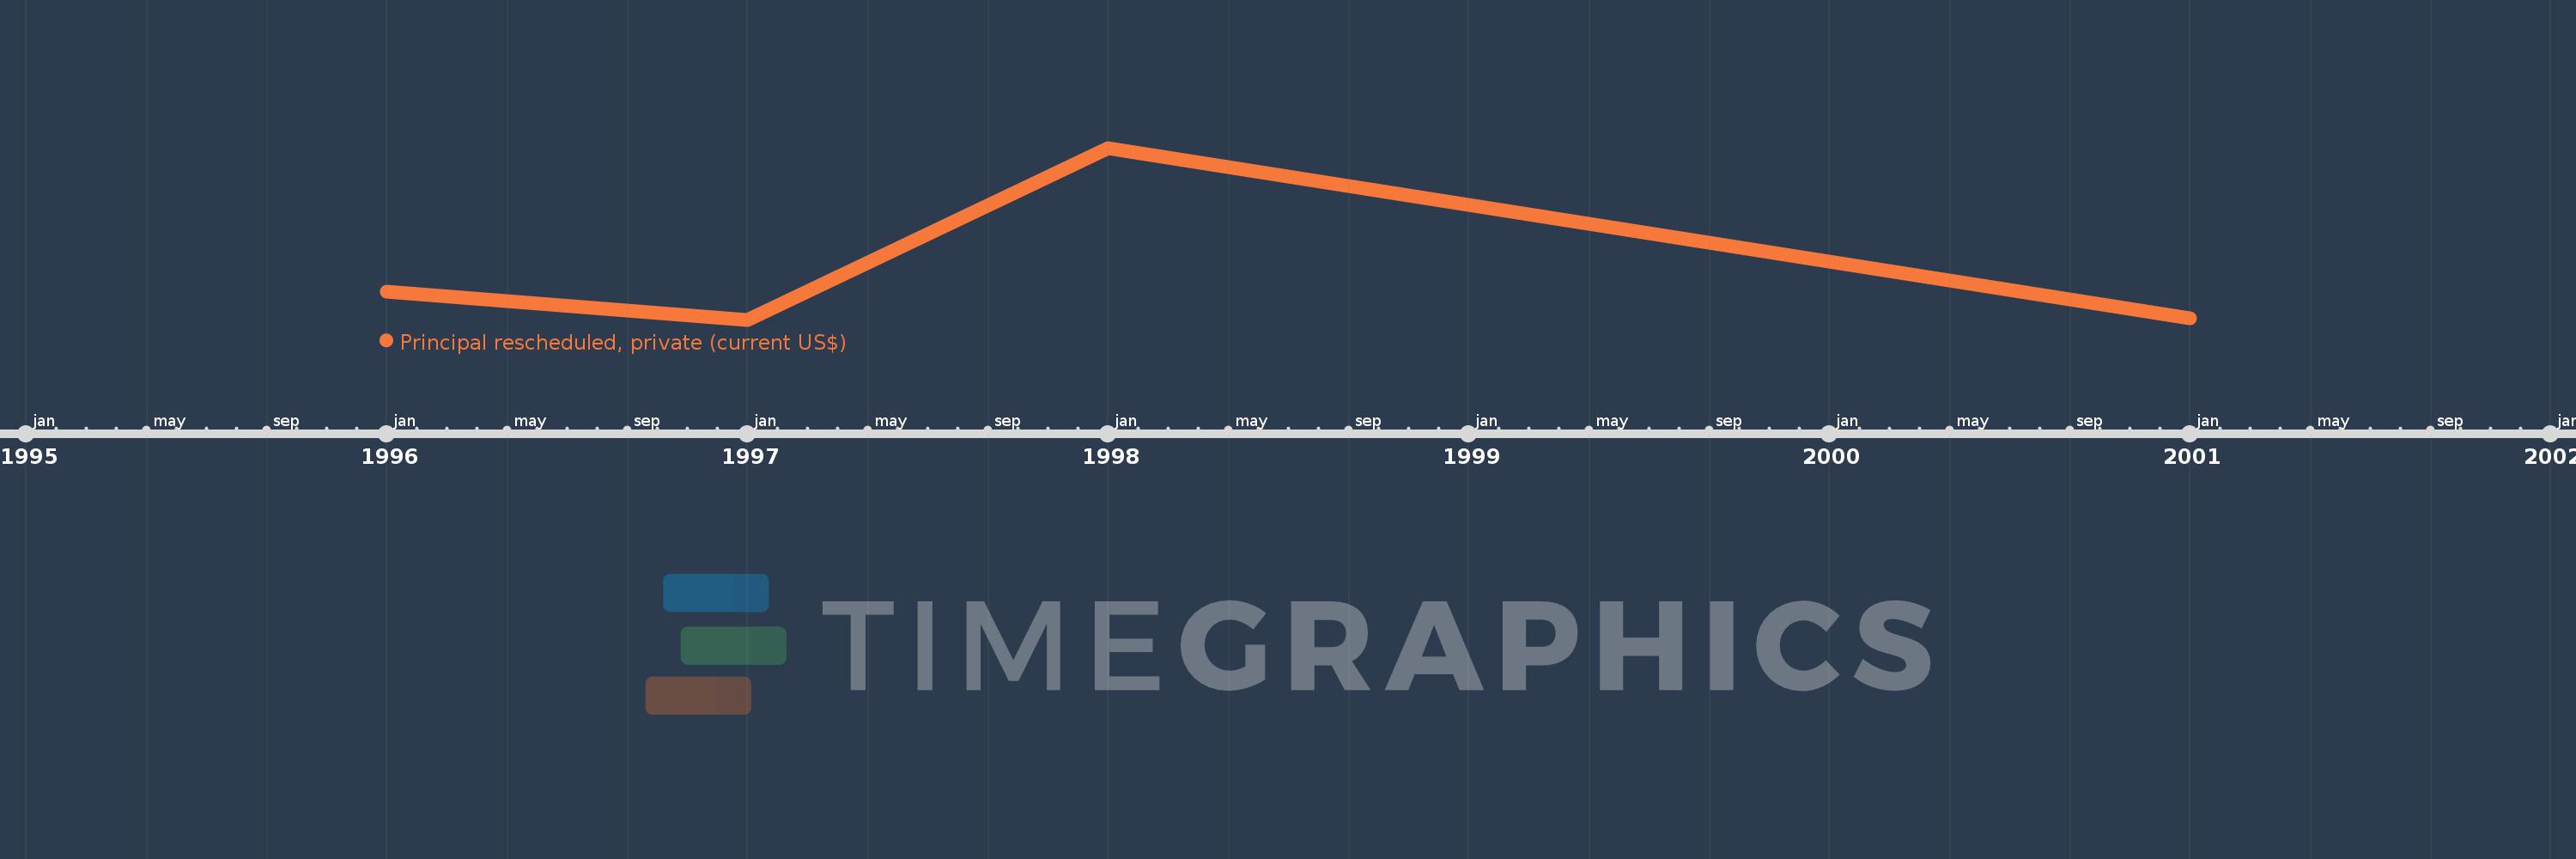
This timeline shows a graph from 1996 to 2001 of Macedonia, FYR. No data until 1995. Number of actual observations by date: 4.
Source name:
World Development Indicators
Source organization:
World Bank, International Debt Statistics.
Categories, topics:
External Debt
Last updated:
apr 23, 2017
Indicators value changes by year
Minimum:
411.0K
jan 1, 1997
Maximum:
39.223 mln
jan 1, 1998
At the date of observation
Value
Absolute change
Change from the previous value
jan 1, 1996
6.792 mln
+6.792 mln
0.0%
jan 1, 1997
411.0K
-6.381 mln
-93.95%
jan 1, 1998
39.223 mln
+38.812 mln
9.44K%
jan 1, 2001
670.0K
-38.553 mln
-98.29%
Ranking of countries by current statistics by years
