29
/
en
AIzaSyAYiBZKx7MnpbEhh9jyipgxe19OcubqV5w
April 1, 2024
156647
Indonesia
IDN
true
2
1
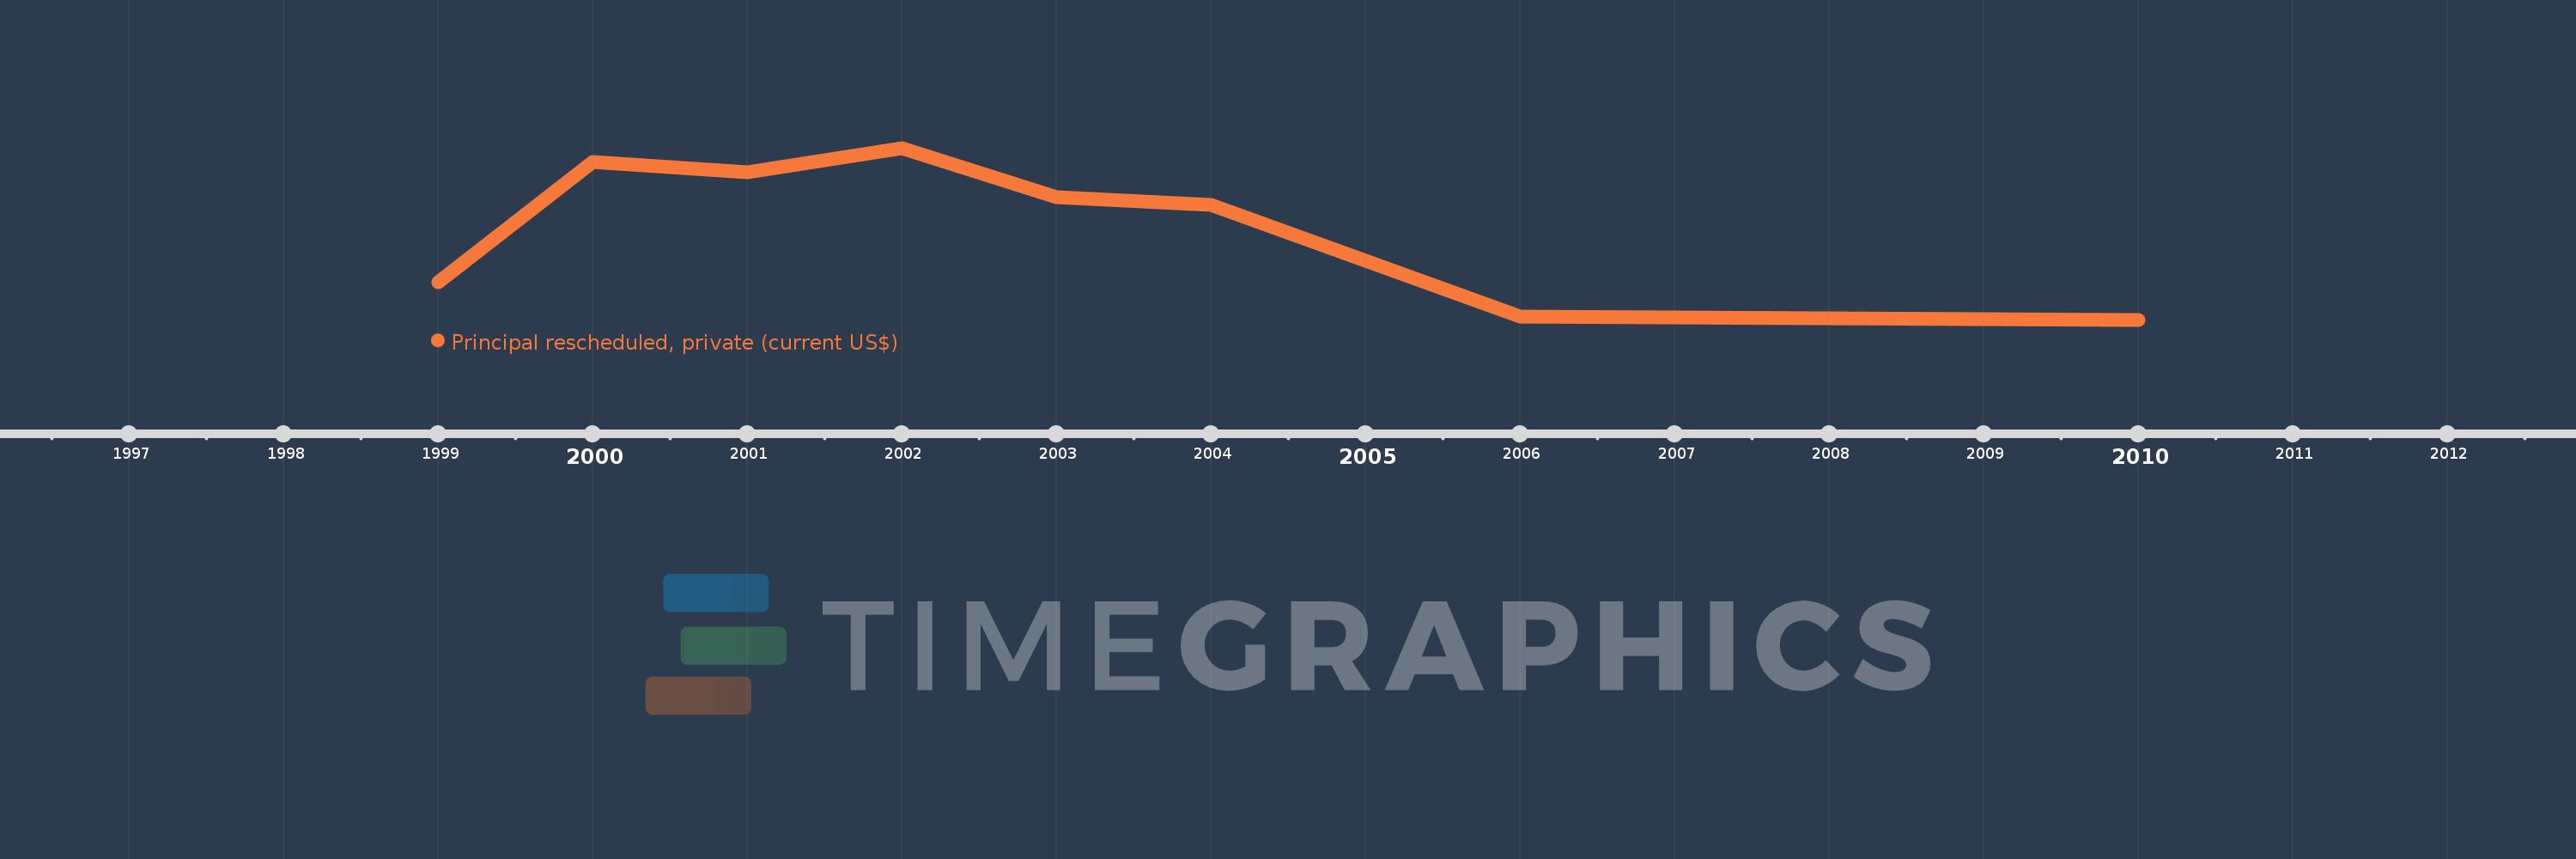
Principal rescheduled, private (current US$)
2010,2006,2004,2003,2002,2001,2000,1999
This statistics in other country:
Timeline:
This timeline shows a graph from 1999 to 2010 of Indonesia. No data until 1998. Number of actual observations by date: 8.
Source name:
World Development Indicators
Source organization:
World Bank, International Debt Statistics.
Categories, topics:
External Debt
Last updated:
apr 23, 2017
Indicators value changes by year
Maximum:
845.841 mln
jan 1, 2002
At the date of observation
Value
Absolute change
Change from previous value
jan 1, 1999
186.167 mln
+186.167 mln
0.0%
jan 1, 2000
775.957 mln
+589.79 mln
316.81%
jan 1, 2001
726.733 mln
-49.224 mln
-6.34%
jan 1, 2002
845.841 mln
+119.108 mln
16.39%
jan 1, 2003
602.85 mln
-242.991 mln
-28.73%
jan 1, 2004
564.468 mln
-38.382 mln
-6.37%
jan 1, 2006
16.765 mln
-547.703 mln
-97.03%
jan 1, 2010
0.0
-16.765 mln
-100.0%
Ranking of countries by current statistics by years


Comments: