29
/
en
AIzaSyAYiBZKx7MnpbEhh9jyipgxe19OcubqV5w
April 1, 2024
211015
Nicaragua
NIC
true
2
1
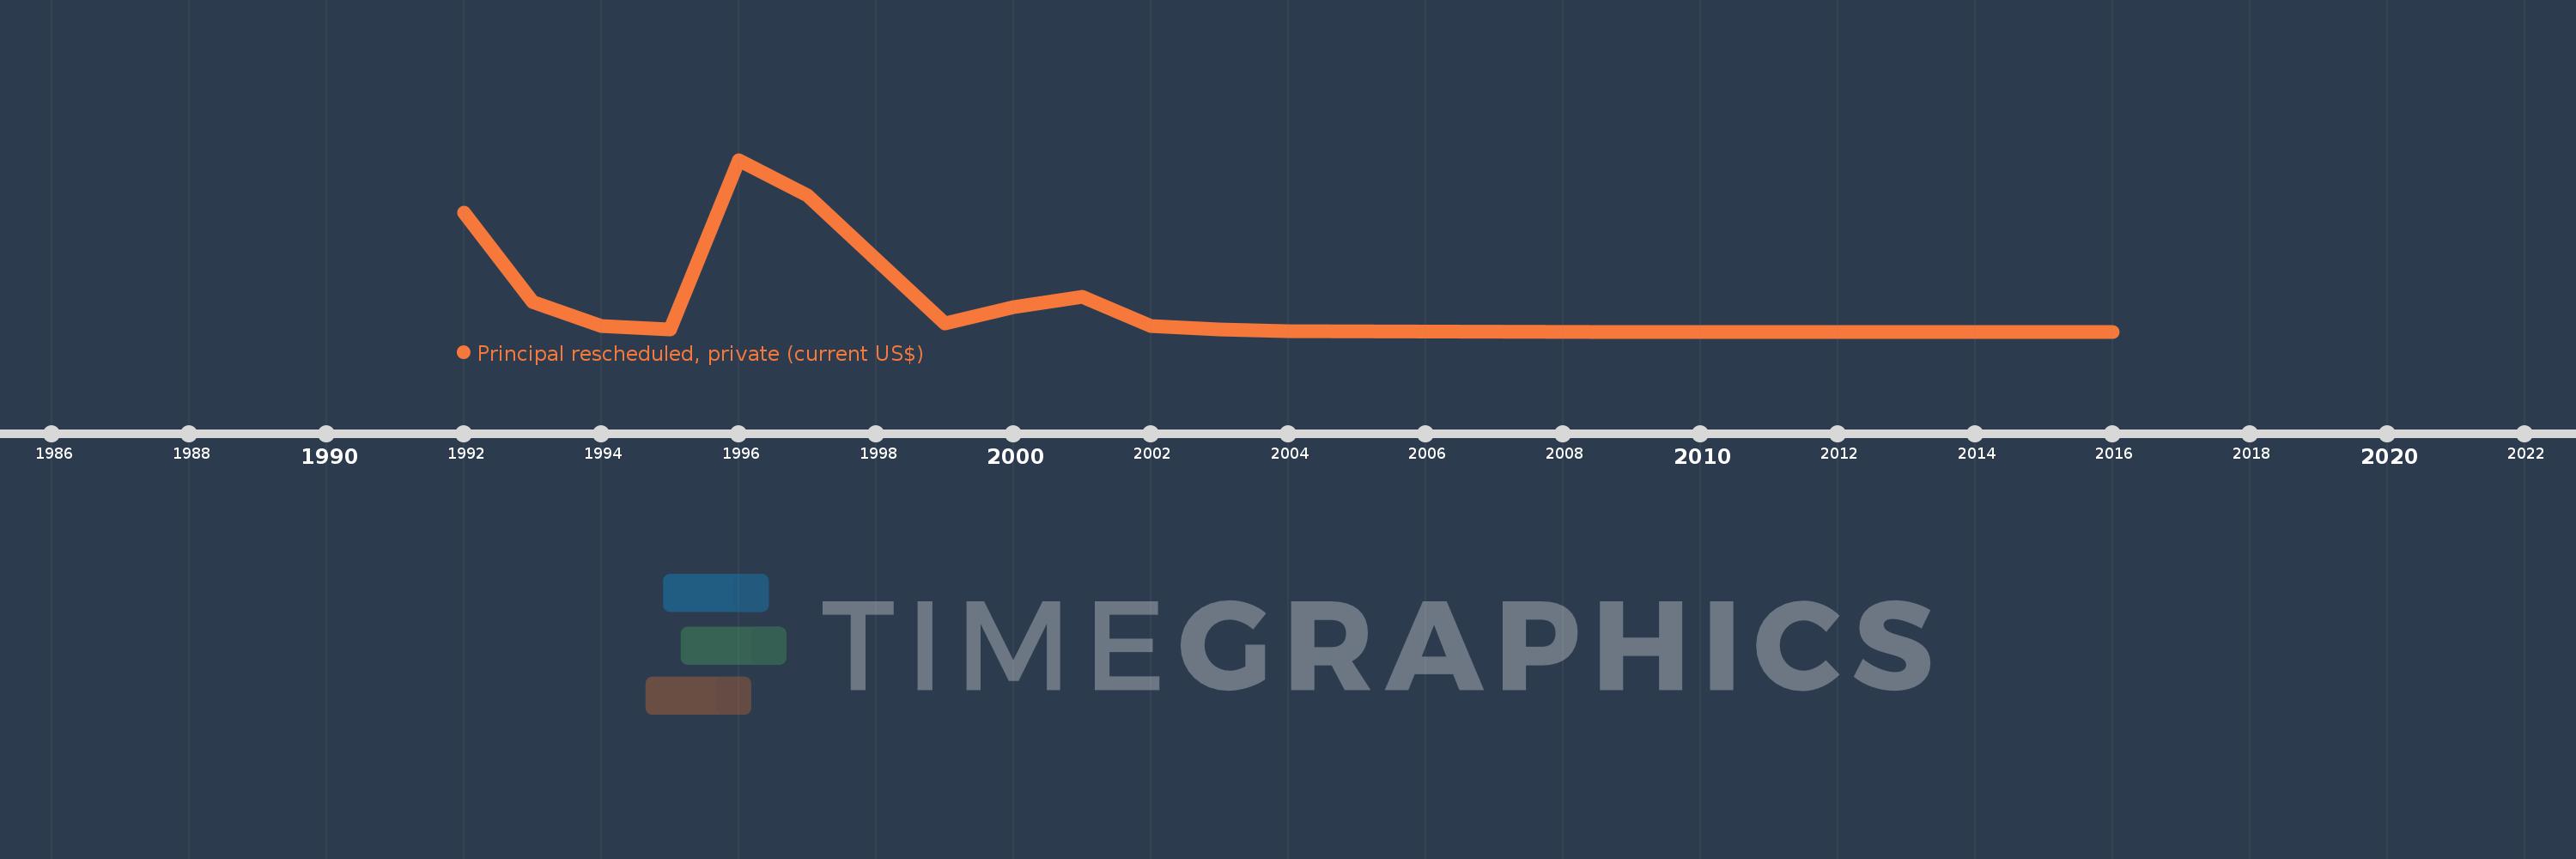
Principal rescheduled, private (current US$)
2016,2013,2012,2011,2009,2004,2003,2002,2001,2000,1999,1997,1996,1995,1994,1993,1992
This statistics in other country:
Timeline:
This timeline shows a graph from 1992 to 2016 of Nicaragua. No data until 1991. Number of actual observations by date: 17.
Source name:
World Development Indicators
Source organization:
World Bank, International Debt Statistics.
Categories, topics:
External Debt
Last updated:
apr 23, 2017
Indicators value changes by year
Maximum:
61.402 mln
jan 1, 1996
At the date of observation
Value
Absolute change
Change from previous value
jan 1, 1992
42.606 mln
+42.606 mln
0.0%
jan 1, 1993
10.516 mln
-32.09 mln
-75.32%
jan 1, 1994
2.101 mln
-8.415 mln
-80.02%
jan 1, 1995
862.0K
-1.239 mln
-58.97%
jan 1, 1996
61.402 mln
+60.54 mln
7.02K%
jan 1, 1997
48.565 mln
-12.837 mln
-20.91%
jan 1, 1999
3.03 mln
-45.535 mln
-93.76%
jan 1, 2000
8.648 mln
+5.618 mln
185.41%
jan 1, 2001
12.452 mln
+3.804 mln
43.99%
jan 1, 2002
2.045 mln
-10.407 mln
-83.58%
jan 1, 2003
641.0K
-1.404 mln
-68.66%
jan 1, 2004
4.0K
-637.0K
-99.38%
jan 1, 2009
0.0
-4.0K
-100.0%
Ranking of countries by current statistics by years


Comments: