29
/
en
AIzaSyAYiBZKx7MnpbEhh9jyipgxe19OcubqV5w
April 1, 2024
131094
Ethiopia
ETH
true
2
1
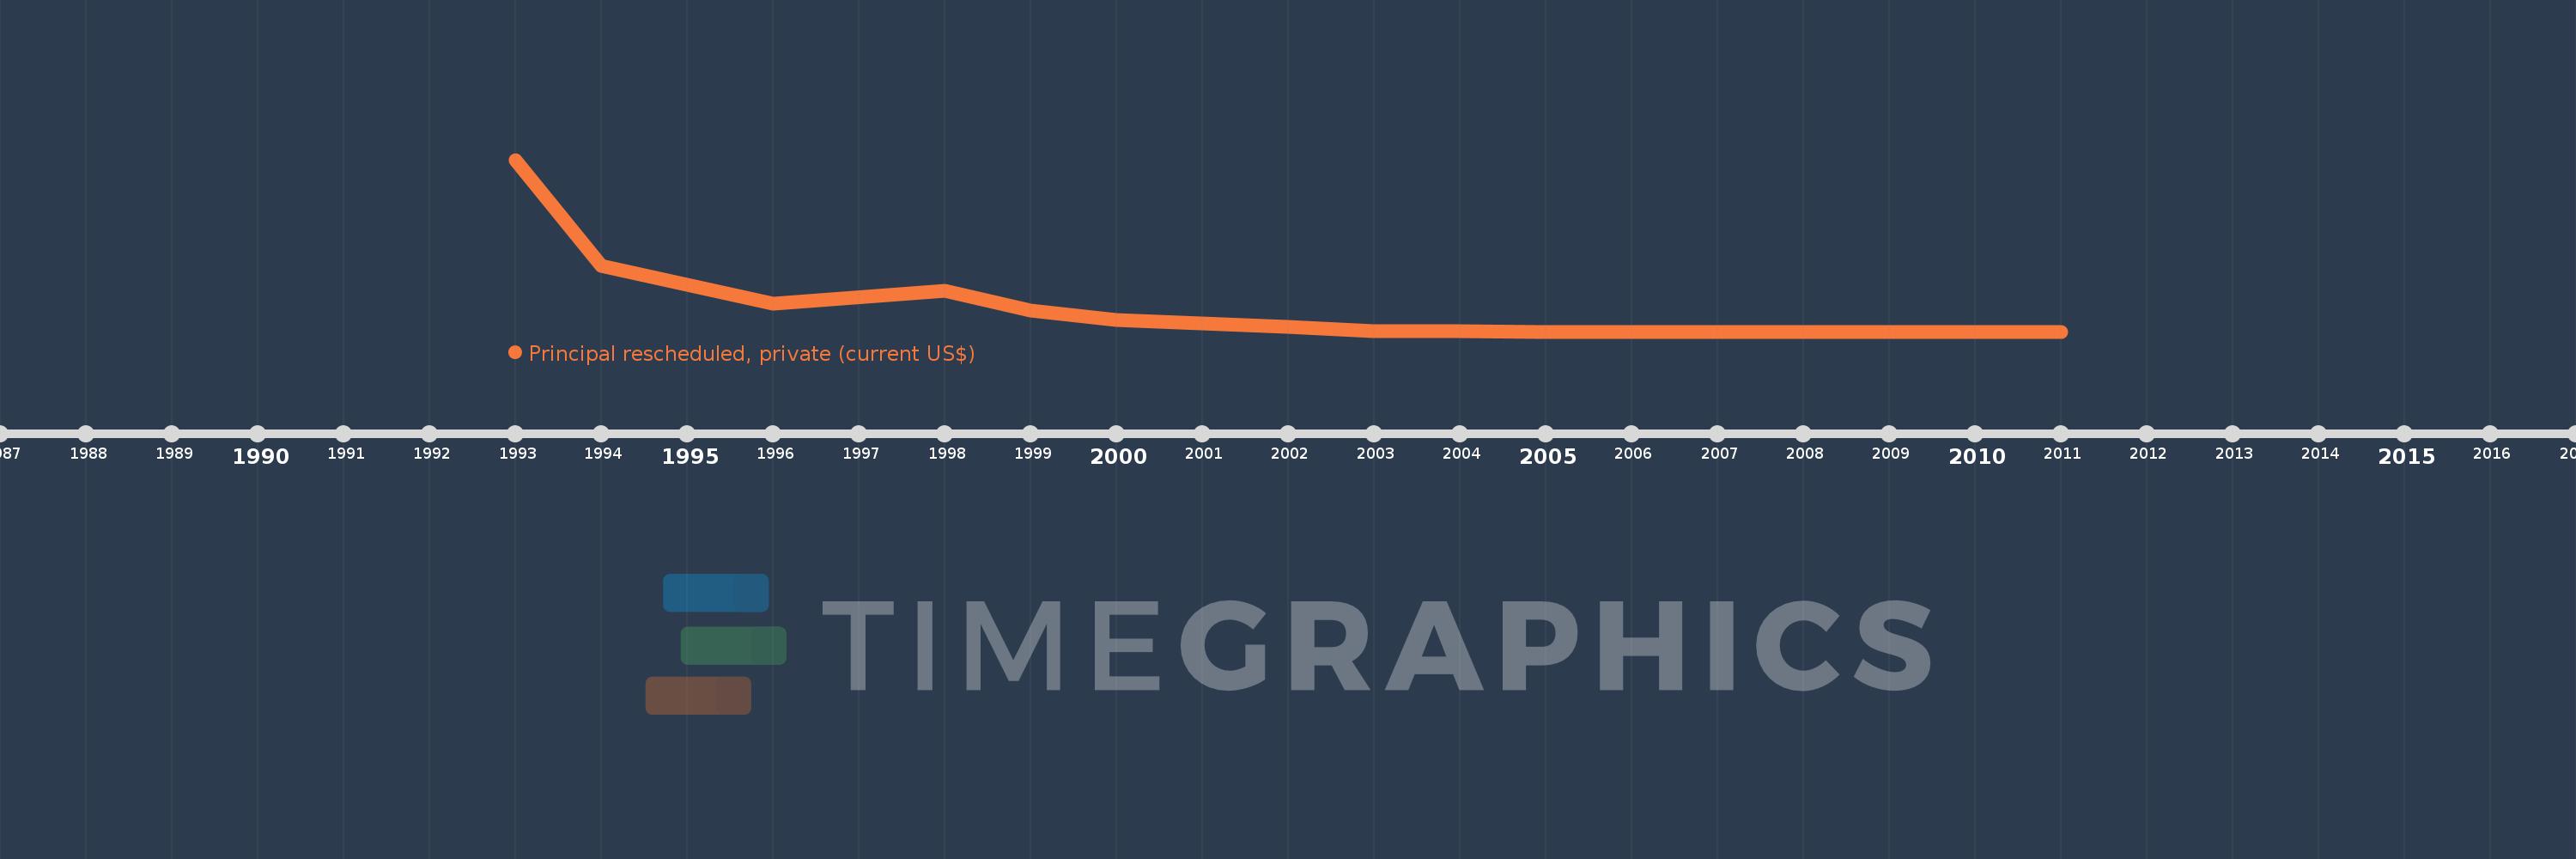
Principal rescheduled, private (current US$)
2011,2007,2006,2005,2004,2003,2002,2000,1999,1998,1996,1995,1994,1993
This statistics in other country:
Timeline:
This timeline shows a graph from 1993 to 2011 of Ethiopia. No data until 1992. Number of actual observations by date: 14.
Source name:
World Development Indicators
Source organization:
World Bank, International Debt Statistics.
Categories, topics:
External Debt
Last updated:
apr 23, 2017
Indicators value changes by year
Maximum:
68.319 mln
jan 1, 1993
At the date of observation
Value
Absolute change
Change from previous value
jan 1, 1993
68.319 mln
+68.319 mln
0.0%
jan 1, 1994
26.061 mln
-42.258 mln
-61.85%
jan 1, 1995
18.662 mln
-7.399 mln
-28.39%
jan 1, 1996
11.073 mln
-7.589 mln
-40.67%
jan 1, 1998
16.192 mln
+5.119 mln
46.23%
jan 1, 1999
8.219 mln
-7.973 mln
-49.24%
jan 1, 2000
4.493 mln
-3.726 mln
-45.33%
jan 1, 2002
1.837 mln
-2.656 mln
-59.11%
jan 1, 2003
198.0K
-1.639 mln
-89.22%
jan 1, 2004
237.0K
+39.0K
19.7%
jan 1, 2005
0.0
-237.0K
-100.0%
Ranking of countries by current statistics by years


Comments: