29
/
en
AIzaSyAYiBZKx7MnpbEhh9jyipgxe19OcubqV5w
April 1, 2024
272223
Uganda
UGA
true
2
1
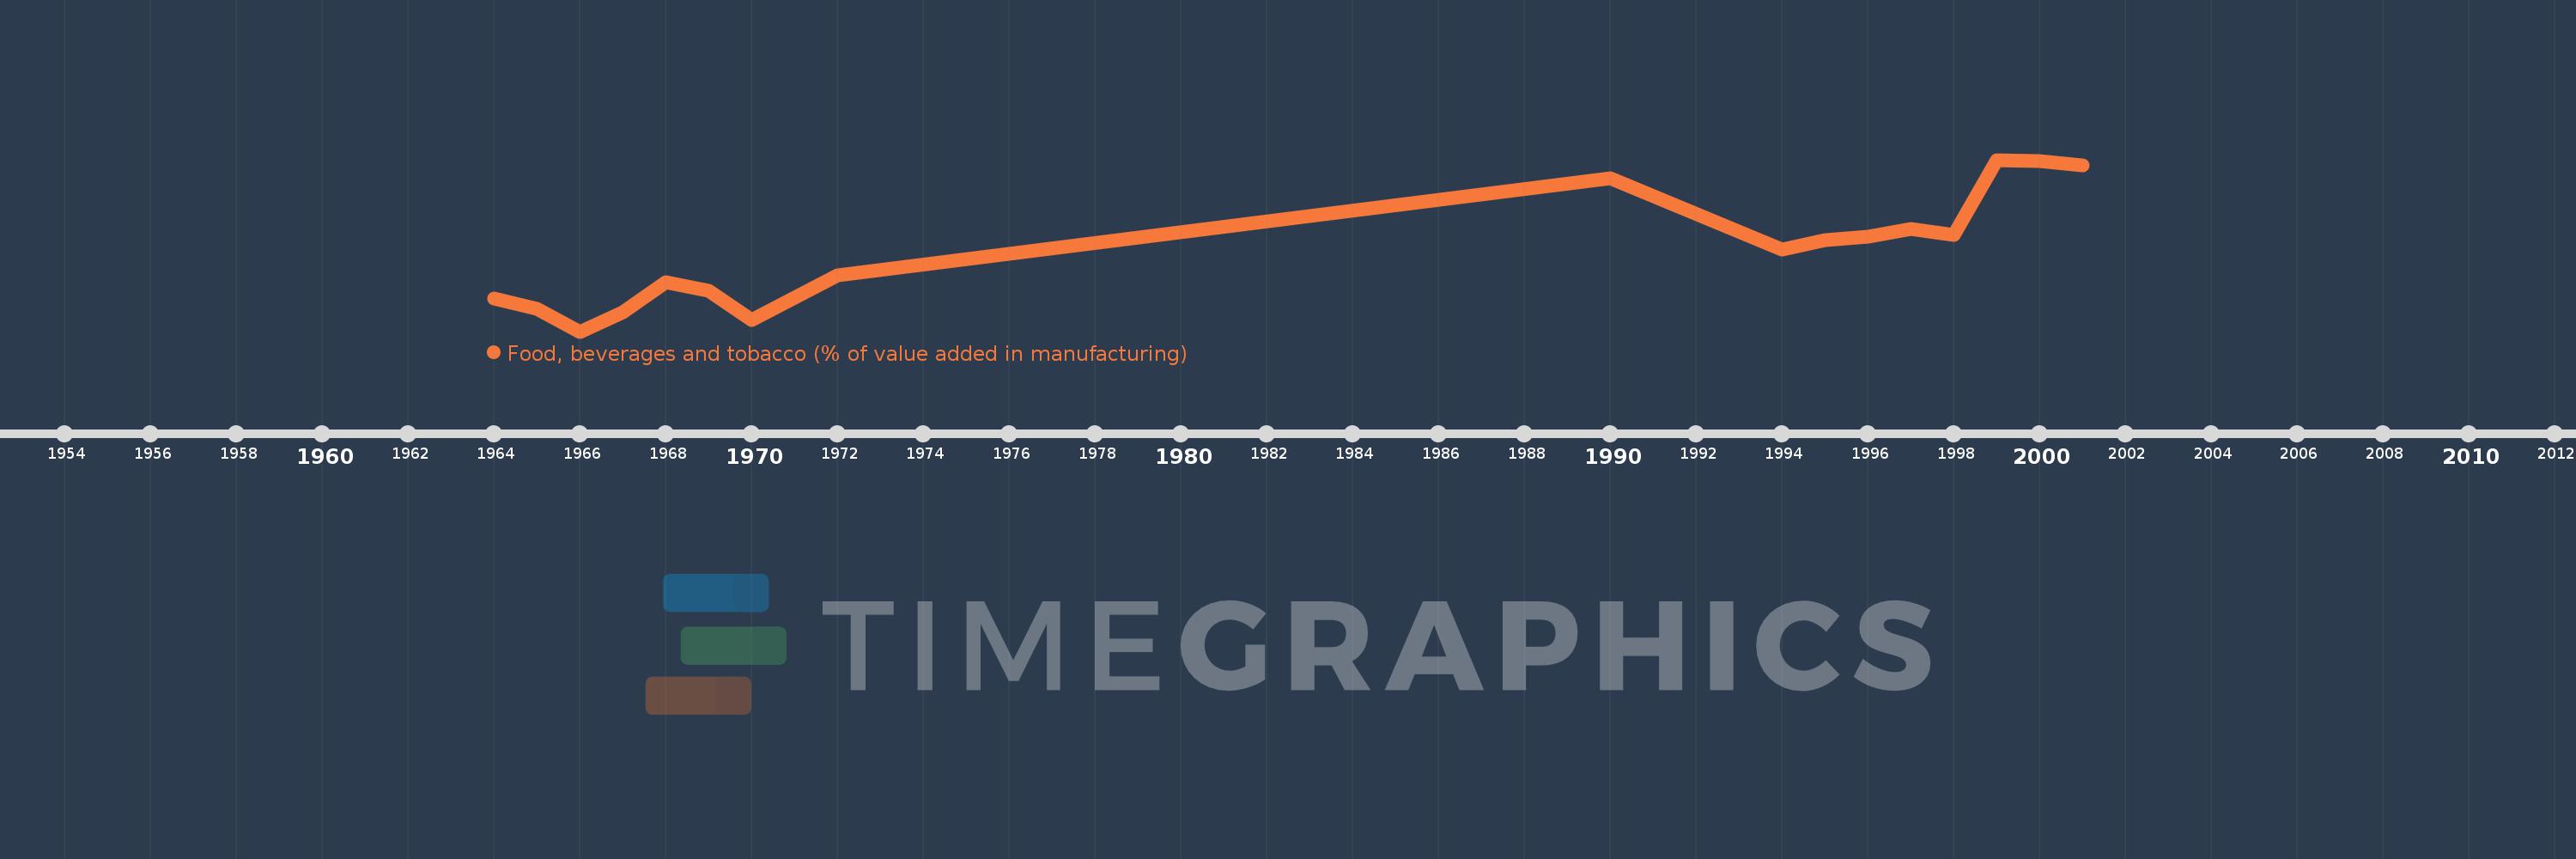
Food, beverages and tobacco (% of value added in manufacturing)
2001,2000,1999,1998,1997,1996,1995,1994,1990,1972,1970,1969,1968,1967,1966,1965,1964
This statistics in other country:
AlbaniaAlgeriaArgentinaAustraliaAustriaAzerbaijanBahamas, TheBahrainBangladeshBarbadosBelarusBelgiumBelizeBeninBoliviaBosnia and HerzegovinaBotswanaBrazilBulgariaBurkina FasoBurundiCambodiaCameroonCanadaCentral African RepublicChileChinaColombiaCongo, Rep.Costa RicaCote d'IvoireCroatiaCubaCyprusCzech RepublicDenmarkDominican RepublicEcuadorEgypt, Arab Rep.El SalvadorEritreaEstoniaEthiopiaFijiFinlandFranceGabonGambia, TheGeorgiaGermanyGhanaGreeceGuatemalaHondurasHong Kong SAR, ChinaHungaryIcelandIndiaIndonesiaIran, Islamic Rep.IraqIrelandIsraelItalyJamaicaJapanJordanKazakhstanKenyaKorea, Rep.KuwaitKyrgyz RepublicLao PDRLatviaLebanonLesothoLibyaLithuaniaLuxembourgMacao SAR, ChinaMacedonia, FYRMadagascarMalawiMalaysiaMaltaMauritiusMexicoMoldovaMongoliaMoroccoMozambiqueNamibiaNepalNetherlandsNew ZealandNicaraguaNigerNigeriaNorwayOmanPakistanPanamaPapua New GuineaParaguayPeruPhilippinesPolandPortugalPuerto RicoQatarRomaniaRussian FederationRwandaSaudi ArabiaSenegalSerbiaSierra LeoneSingaporeSlovak RepublicSloveniaSomaliaSouth AfricaSpainSri LankaSt. LuciaSudanSwazilandSwedenSwitzerlandSyrian Arab RepublicTanzaniaThailandTongaTrinidad and TobagoTunisiaTurkeyUgandaUkraineUnited Arab EmiratesUnited KingdomUnited StatesUruguayVenezuela, RBVietnamWest Bank and GazaYemen, Rep.Zambia Timeline:
This timeline shows a graph from 1964 to 2001 of Uganda. No data until 1963. Number of actual observations by date: 17.
Source name:
World Development Indicators
Source organization:
United Nations Industrial Development Organization, International Yearbook of Industrial Statistics.
Categories, topics:
Economy & Growth
Last updated:
apr 23, 2017
Indicators value changes by year
Minimum:
28.215
jan 1, 1966
Maximum:
65.037
jan 1, 1999
At the date of observation
Value
Absolute change
Change from previous value
jan 1, 1964
35.326
+35.326
0.0%
jan 1, 1965
33.079
-2.247
-6.36%
jan 1, 1966
28.215
-4.864
-14.7%
jan 1, 1967
32.447
+4.232
15.0%
jan 1, 1968
38.823
+6.376
19.65%
jan 1, 1969
36.974
-1.849
-4.76%
jan 1, 1970
30.632
-6.341
-17.15%
jan 1, 1972
40.202
+9.57
31.24%
jan 1, 1990
61.077
+20.875
51.93%
jan 1, 1994
45.881
-15.196
-24.88%
jan 1, 1995
47.872
+1.991
4.34%
jan 1, 1996
48.575
+0.702
1.47%
jan 1, 1997
50.233
+1.658
3.41%
jan 1, 1998
48.952
-1.281
-2.55%
jan 1, 1999
65.037
+16.085
32.86%
jan 1, 2000
64.719
-0.318
-0.49%
jan 1, 2001
63.907
-0.812
-1.25%
Ranking of countries by current statistics by years


Comments: