29
/
en
AIzaSyAYiBZKx7MnpbEhh9jyipgxe19OcubqV5w
April 1, 2024
122106
Dominican Republic
DOM
true
2
1
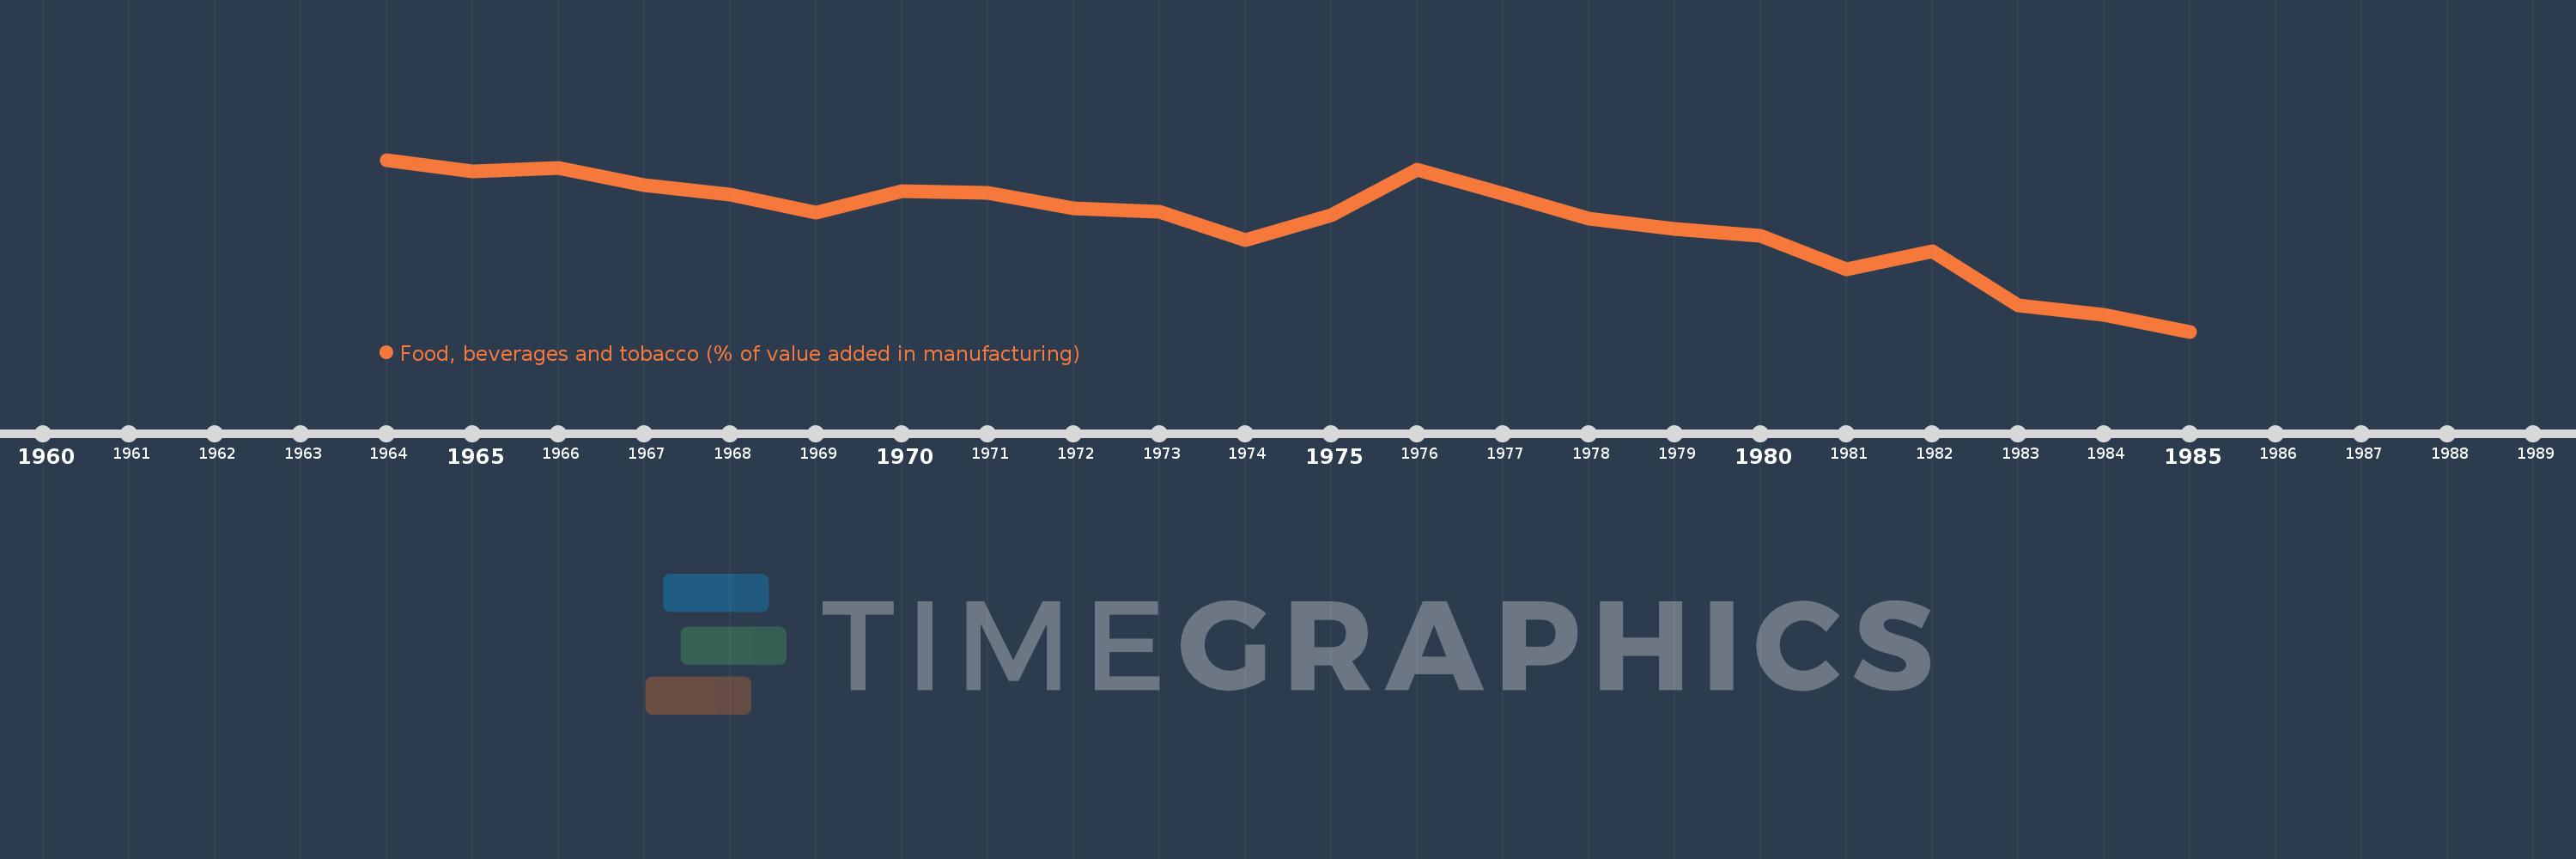
Food, beverages and tobacco (% of value added in manufacturing)
1985,1984,1983,1982,1981,1980,1979,1978,1977,1976,1975,1974,1973,1972,1971,1970,1969,1968,1967,1966,1965,1964
This statistics in other country:
AlbaniaAlgeriaArgentinaAustraliaAustriaAzerbaijanBahamas, TheBahrainBangladeshBarbadosBelarusBelgiumBelizeBeninBoliviaBosnia and HerzegovinaBotswanaBrazilBulgariaBurkina FasoBurundiCambodiaCameroonCanadaCentral African RepublicChileChinaColombiaCongo, Rep.Costa RicaCote d'IvoireCroatiaCubaCyprusCzech RepublicDenmarkDominican RepublicEcuadorEgypt, Arab Rep.El SalvadorEritreaEstoniaEthiopiaFijiFinlandFranceGabonGambia, TheGeorgiaGermanyGhanaGreeceGuatemalaHondurasHong Kong SAR, ChinaHungaryIcelandIndiaIndonesiaIran, Islamic Rep.IraqIrelandIsraelItalyJamaicaJapanJordanKazakhstanKenyaKorea, Rep.KuwaitKyrgyz RepublicLao PDRLatviaLebanonLesothoLibyaLithuaniaLuxembourgMacao SAR, ChinaMacedonia, FYRMadagascarMalawiMalaysiaMaltaMauritiusMexicoMoldovaMongoliaMoroccoMozambiqueNamibiaNepalNetherlandsNew ZealandNicaraguaNigerNigeriaNorwayOmanPakistanPanamaPapua New GuineaParaguayPeruPhilippinesPolandPortugalPuerto RicoQatarRomaniaRussian FederationRwandaSaudi ArabiaSenegalSerbiaSierra LeoneSingaporeSlovak RepublicSloveniaSomaliaSouth AfricaSpainSri LankaSt. LuciaSudanSwazilandSwedenSwitzerlandSyrian Arab RepublicTanzaniaThailandTongaTrinidad and TobagoTunisiaTurkeyUgandaUkraineUnited Arab EmiratesUnited KingdomUnited StatesUruguayVenezuela, RBVietnamWest Bank and GazaYemen, Rep.Zambia Timeline:
This timeline shows a graph from 1964 to 1985 of Dominican Republic. No data until 1963. Number of actual observations by date: 22.
Source name:
World Development Indicators
Source organization:
United Nations Industrial Development Organization, International Yearbook of Industrial Statistics.
Categories, topics:
Economy & Growth
Last updated:
apr 23, 2017
Indicators value changes by year
Minimum:
58.756
jan 1, 1985
Maximum:
77.315
jan 1, 1964
At the date of observation
Value
Absolute change
Change from previous value
jan 1, 1964
77.315
+77.315
0.0%
jan 1, 1965
76.07
-1.245
-1.61%
jan 1, 1966
76.39
+0.321
0.42%
jan 1, 1967
74.534
-1.856
-2.43%
jan 1, 1968
73.555
-0.979
-1.31%
jan 1, 1969
71.645
-1.91
-2.6%
jan 1, 1970
73.939
+2.294
3.2%
jan 1, 1971
73.714
-0.225
-0.3%
jan 1, 1972
72.095
-1.618
-2.2%
jan 1, 1973
71.704
-0.391
-0.54%
jan 1, 1974
68.629
-3.075
-4.29%
jan 1, 1975
71.357
+2.728
3.97%
jan 1, 1976
76.288
+4.931
6.91%
jan 1, 1977
73.676
-2.611
-3.42%
jan 1, 1978
70.978
-2.698
-3.66%
jan 1, 1979
69.889
-1.089
-1.53%
jan 1, 1980
69.069
-0.82
-1.17%
jan 1, 1981
65.509
-3.559
-5.15%
jan 1, 1982
67.452
+1.943
2.97%
jan 1, 1983
61.578
-5.874
-8.71%
jan 1, 1984
60.565
-1.013
-1.65%
jan 1, 1985
58.756
-1.808
-2.99%
Ranking of countries by current statistics by years


Comments: