29
/
en
AIzaSyAYiBZKx7MnpbEhh9jyipgxe19OcubqV5w
April 1, 2024
113564
Cote d'Ivoire
CIV
true
2
1
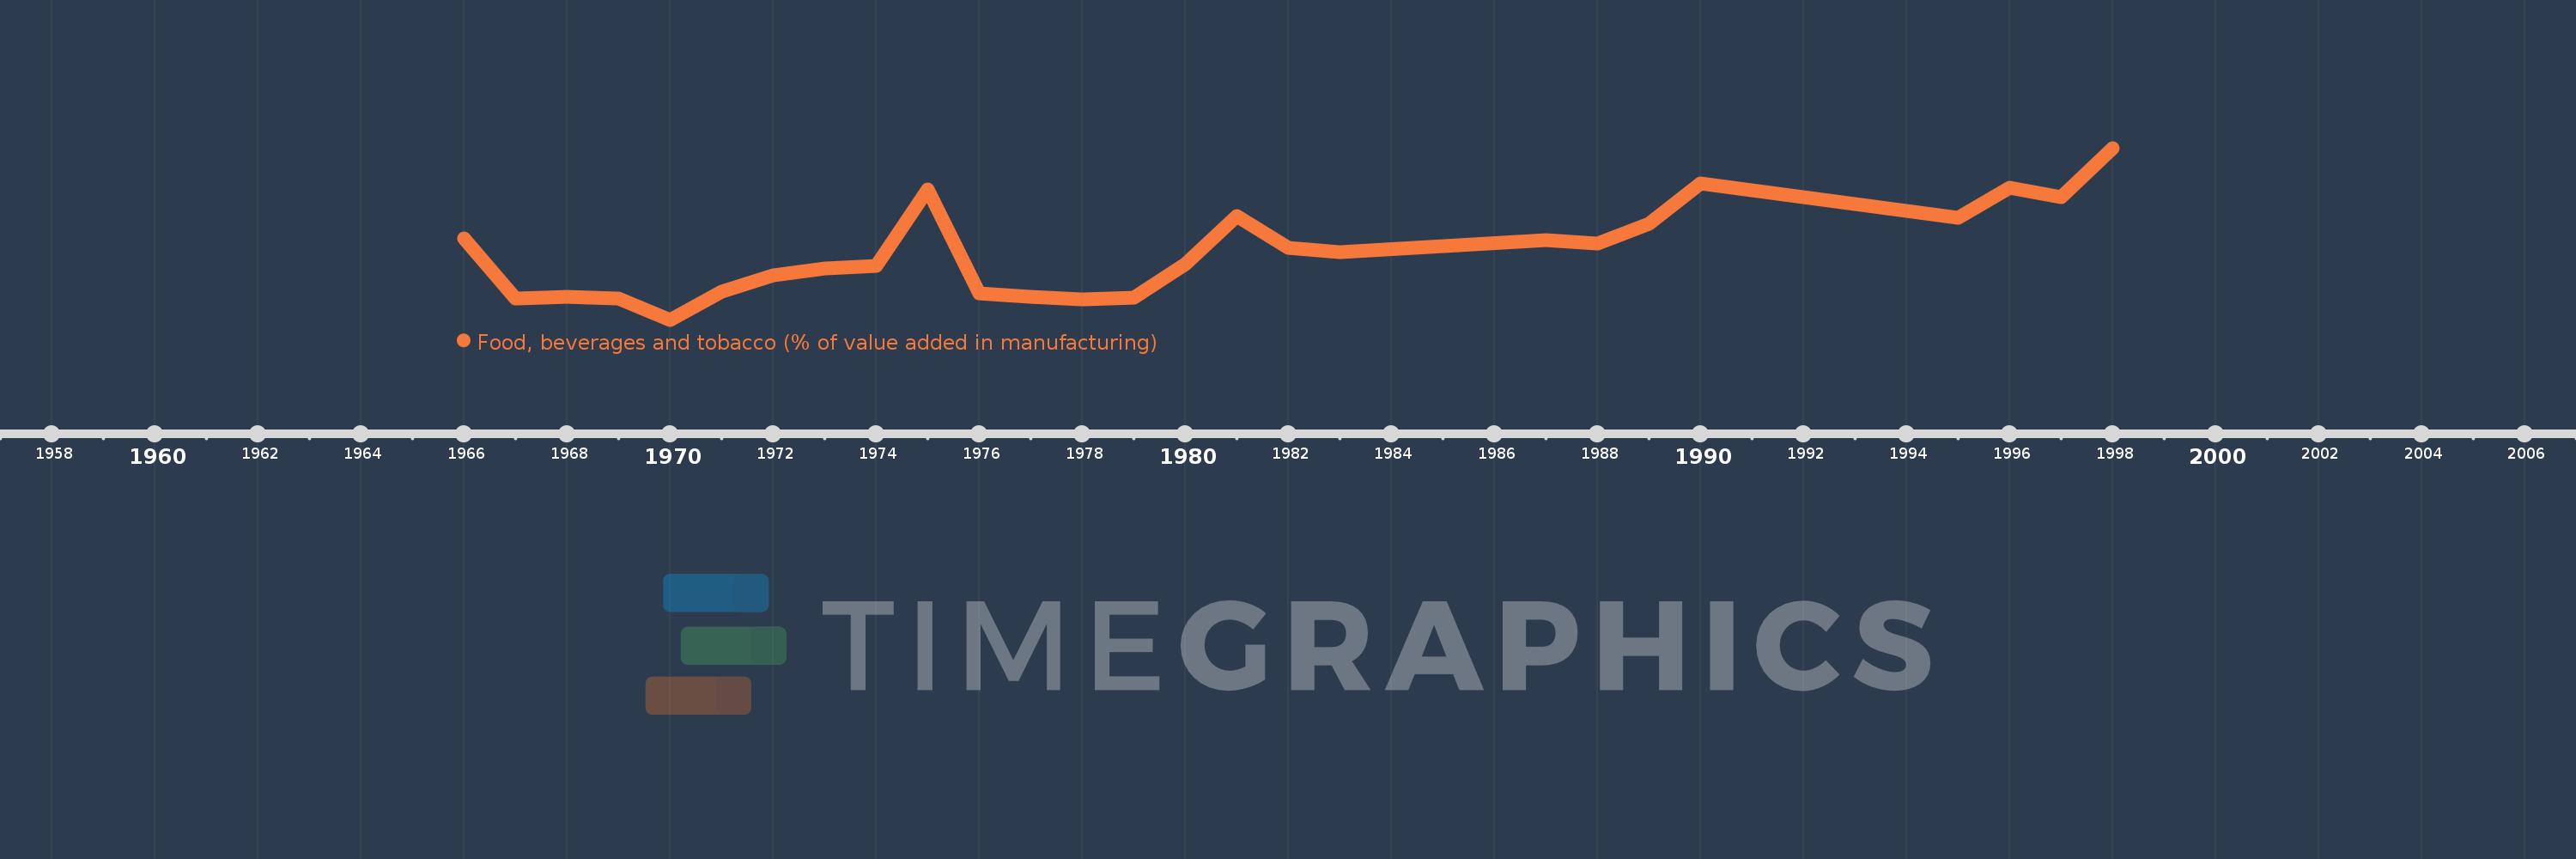
Food, beverages and tobacco (% of value added in manufacturing)
1998,1997,1996,1995,1990,1989,1988,1987,1983,1982,1981,1980,1979,1978,1977,1976,1975,1974,1973,1972,1971,1970,1969,1968,1967,1966
This statistics in other country:
AlbaniaAlgeriaArgentinaAustraliaAustriaAzerbaijanBahamas, TheBahrainBangladeshBarbadosBelarusBelgiumBelizeBeninBoliviaBosnia and HerzegovinaBotswanaBrazilBulgariaBurkina FasoBurundiCambodiaCameroonCanadaCentral African RepublicChileChinaColombiaCongo, Rep.Costa RicaCote d'IvoireCroatiaCubaCyprusCzech RepublicDenmarkDominican RepublicEcuadorEgypt, Arab Rep.El SalvadorEritreaEstoniaEthiopiaFijiFinlandFranceGabonGambia, TheGeorgiaGermanyGhanaGreeceGuatemalaHondurasHong Kong SAR, ChinaHungaryIcelandIndiaIndonesiaIran, Islamic Rep.IraqIrelandIsraelItalyJamaicaJapanJordanKazakhstanKenyaKorea, Rep.KuwaitKyrgyz RepublicLao PDRLatviaLebanonLesothoLibyaLithuaniaLuxembourgMacao SAR, ChinaMacedonia, FYRMadagascarMalawiMalaysiaMaltaMauritiusMexicoMoldovaMongoliaMoroccoMozambiqueNamibiaNepalNetherlandsNew ZealandNicaraguaNigerNigeriaNorwayOmanPakistanPanamaPapua New GuineaParaguayPeruPhilippinesPolandPortugalPuerto RicoQatarRomaniaRussian FederationRwandaSaudi ArabiaSenegalSerbiaSierra LeoneSingaporeSlovak RepublicSloveniaSomaliaSouth AfricaSpainSri LankaSt. LuciaSudanSwazilandSwedenSwitzerlandSyrian Arab RepublicTanzaniaThailandTongaTrinidad and TobagoTunisiaTurkeyUgandaUkraineUnited Arab EmiratesUnited KingdomUnited StatesUruguayVenezuela, RBVietnamWest Bank and GazaYemen, Rep.Zambia Timeline:
This timeline shows a graph from 1966 to 1998 of Cote d'Ivoire. No data until 1965. Number of actual observations by date: 26.
Source name:
World Development Indicators
Source organization:
United Nations Industrial Development Organization, International Yearbook of Industrial Statistics.
Categories, topics:
Economy & Growth
Last updated:
apr 23, 2017
Indicators value changes by year
Maximum:
42.006
jan 1, 1998
At the date of observation
Value
Absolute change
Change from previous value
jan 1, 1966
32.482
+32.482
0.0%
jan 1, 1967
26.263
-6.219
-19.15%
jan 1, 1968
26.41
+0.147
0.56%
jan 1, 1969
26.234
-0.176
-0.67%
jan 1, 1970
24.0
-2.234
-8.52%
jan 1, 1971
26.953
+2.954
12.31%
jan 1, 1972
28.687
+1.734
6.43%
jan 1, 1973
29.345
+0.657
2.29%
jan 1, 1974
29.638
+0.293
1.0%
jan 1, 1975
37.618
+7.98
26.93%
jan 1, 1976
26.777
-10.841
-28.82%
jan 1, 1977
26.407
-0.37
-1.38%
jan 1, 1978
26.101
-0.305
-1.16%
jan 1, 1979
26.275
+0.174
0.66%
jan 1, 1980
29.867
+3.592
13.67%
jan 1, 1981
34.853
+4.986
16.69%
jan 1, 1982
31.522
-3.331
-9.56%
jan 1, 1983
31.088
-0.434
-1.38%
jan 1, 1987
32.383
+1.294
4.16%
jan 1, 1988
32.016
-0.367
-1.13%
jan 1, 1989
34.026
+2.011
6.28%
jan 1, 1990
38.286
+4.259
12.52%
jan 1, 1995
34.71
-3.576
-9.34%
jan 1, 1996
37.847
+3.137
9.04%
jan 1, 1997
36.856
-0.991
-2.62%
jan 1, 1998
42.006
+5.151
13.98%
Ranking of countries by current statistics by years


Comments: