29
/
en
AIzaSyAYiBZKx7MnpbEhh9jyipgxe19OcubqV5w
April 1, 2024
172823
Kyrgyz Republic
KGZ
true
2
1
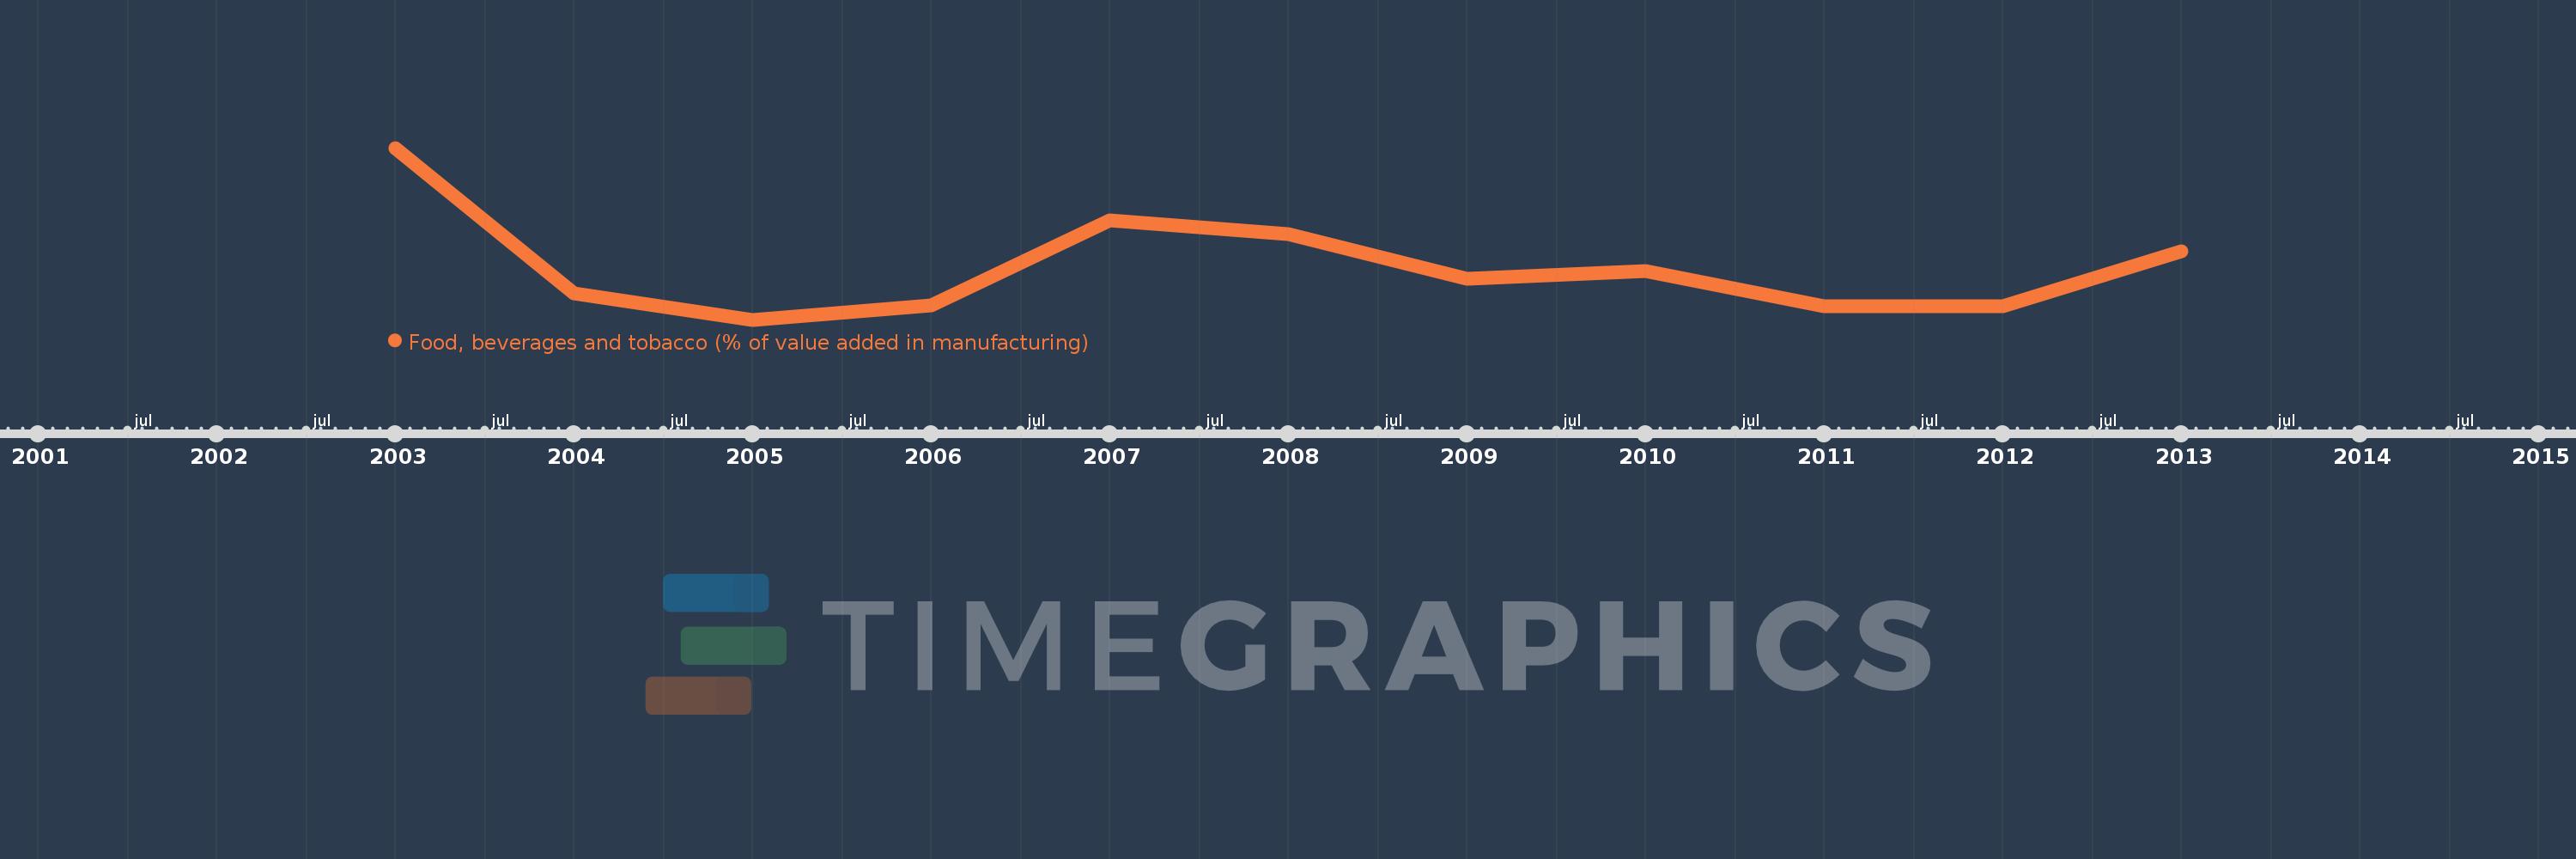
Food, beverages and tobacco (% of value added in manufacturing)
2013,2012,2011,2010,2009,2008,2007,2006,2005,2004,2003
This statistics in other country:
AlbaniaAlgeriaArgentinaAustraliaAustriaAzerbaijanBahamas, TheBahrainBangladeshBarbadosBelarusBelgiumBelizeBeninBoliviaBosnia and HerzegovinaBotswanaBrazilBulgariaBurkina FasoBurundiCambodiaCameroonCanadaCentral African RepublicChileChinaColombiaCongo, Rep.Costa RicaCote d'IvoireCroatiaCubaCyprusCzech RepublicDenmarkDominican RepublicEcuadorEgypt, Arab Rep.El SalvadorEritreaEstoniaEthiopiaFijiFinlandFranceGabonGambia, TheGeorgiaGermanyGhanaGreeceGuatemalaHondurasHong Kong SAR, ChinaHungaryIcelandIndiaIndonesiaIran, Islamic Rep.IraqIrelandIsraelItalyJamaicaJapanJordanKazakhstanKenyaKorea, Rep.KuwaitKyrgyz RepublicLao PDRLatviaLebanonLesothoLibyaLithuaniaLuxembourgMacao SAR, ChinaMacedonia, FYRMadagascarMalawiMalaysiaMaltaMauritiusMexicoMoldovaMongoliaMoroccoMozambiqueNamibiaNepalNetherlandsNew ZealandNicaraguaNigerNigeriaNorwayOmanPakistanPanamaPapua New GuineaParaguayPeruPhilippinesPolandPortugalPuerto RicoQatarRomaniaRussian FederationRwandaSaudi ArabiaSenegalSerbiaSierra LeoneSingaporeSlovak RepublicSloveniaSomaliaSouth AfricaSpainSri LankaSt. LuciaSudanSwazilandSwedenSwitzerlandSyrian Arab RepublicTanzaniaThailandTongaTrinidad and TobagoTunisiaTurkeyUgandaUkraineUnited Arab EmiratesUnited KingdomUnited StatesUruguayVenezuela, RBVietnamWest Bank and GazaYemen, Rep.Zambia Timeline:
This timeline shows a graph from 2003 to 2013 of Kyrgyz Republic. No data until 2002. Number of actual observations by date: 11.
Source name:
World Development Indicators
Source organization:
United Nations Industrial Development Organization, International Yearbook of Industrial Statistics.
Categories, topics:
Economy & Growth
Last updated:
apr 23, 2017
Indicators value changes by year
Minimum:
12.636
jan 1, 2005
Maximum:
33.489
jan 1, 2003
At the date of observation
Value
Absolute change
Change from previous value
jan 1, 2003
33.489
+33.489
0.0%
jan 1, 2004
15.878
-17.612
-52.59%
jan 1, 2005
12.636
-3.241
-20.41%
jan 1, 2006
14.389
+1.752
13.87%
jan 1, 2007
24.686
+10.298
71.57%
jan 1, 2008
23.059
-1.628
-6.59%
jan 1, 2009
17.568
-5.49
-23.81%
jan 1, 2010
18.553
+0.985
5.61%
jan 1, 2011
14.304
-4.249
-22.9%
jan 1, 2012
14.313
+0.008
0.06%
jan 1, 2013
20.894
+6.581
45.98%
Ranking of countries by current statistics by years


Comments: