29
/
en
AIzaSyAYiBZKx7MnpbEhh9jyipgxe19OcubqV5w
April 1, 2024
228461
Romania
ROU
true
2
1
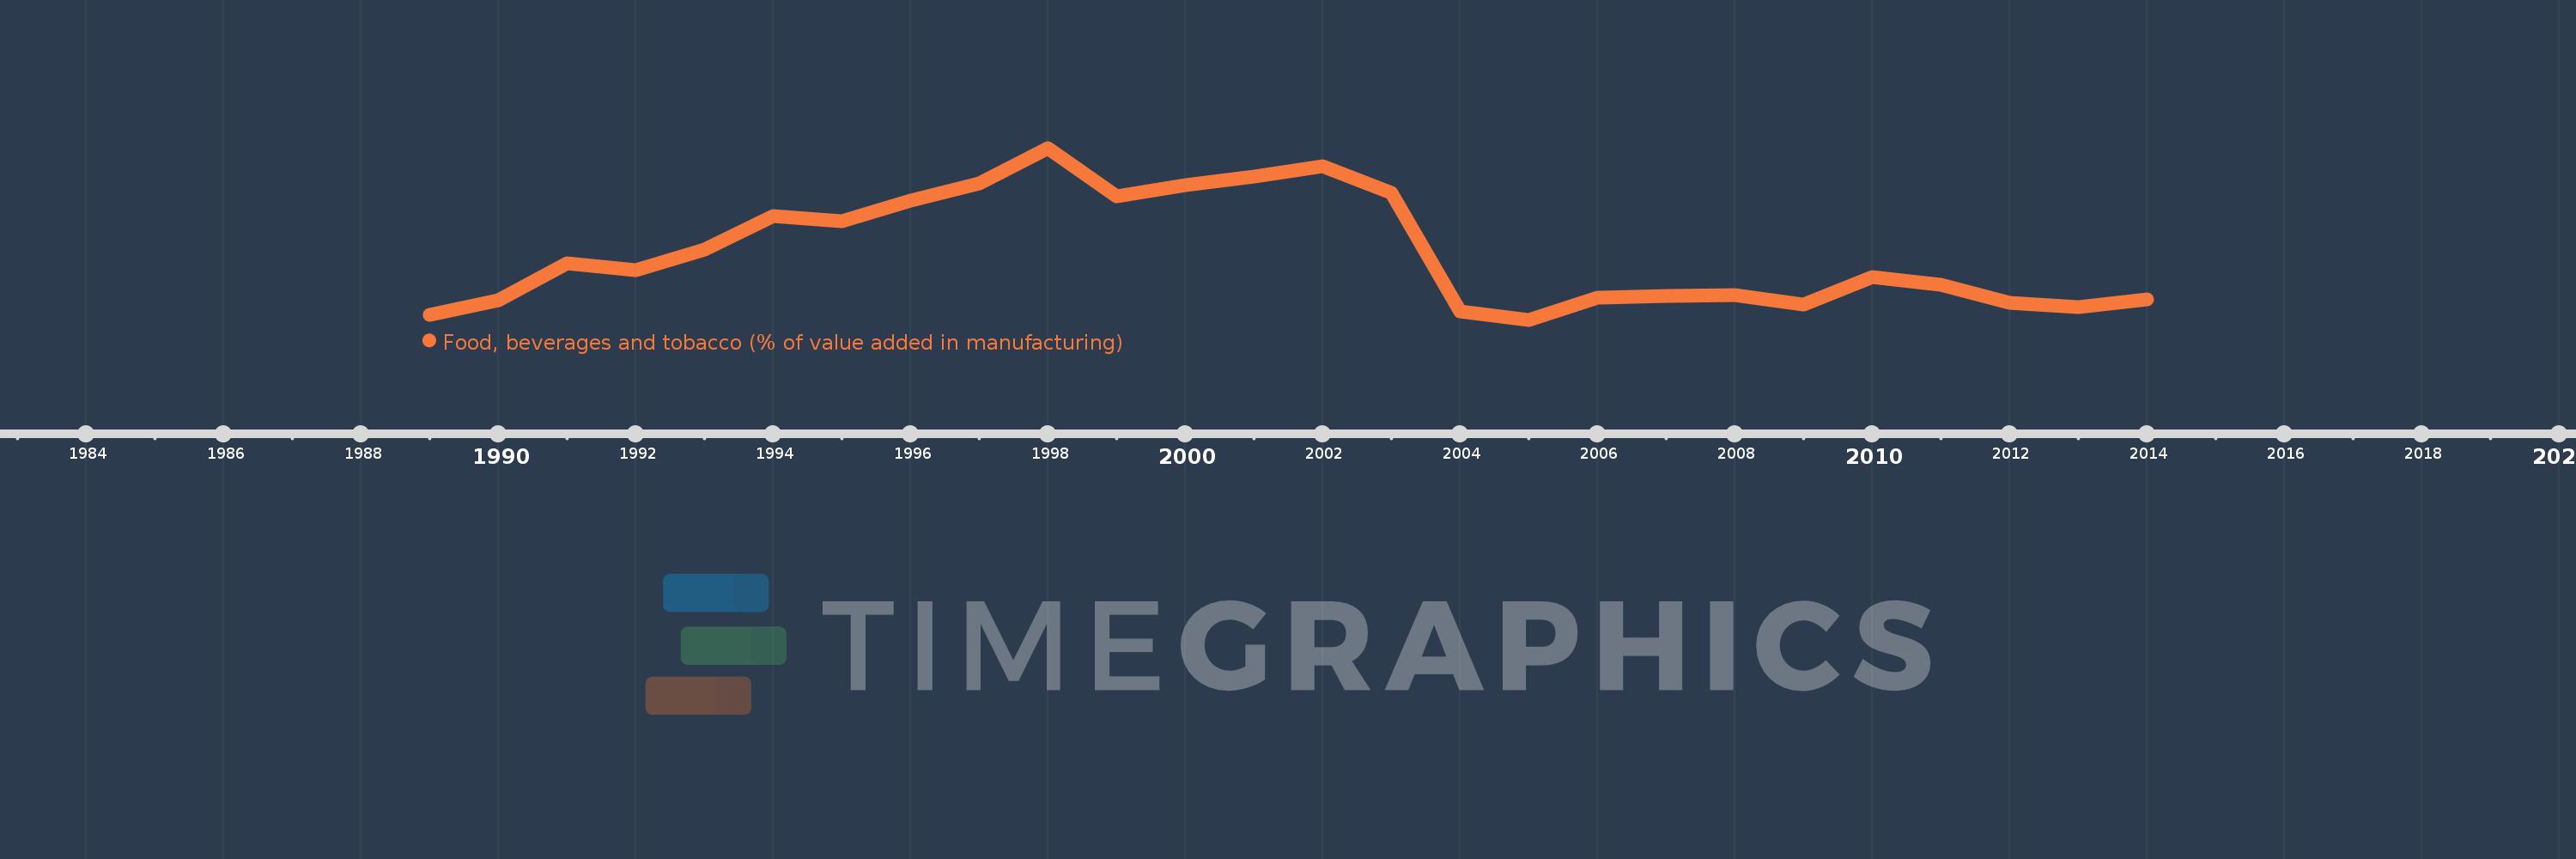
Food, beverages and tobacco (% of value added in manufacturing)
2014,2013,2012,2011,2010,2009,2008,2007,2006,2005,2004,2003,2002,2001,2000,1999,1998,1997,1996,1995,1994,1993,1992,1991,1990,1989
This statistics in other country:
AlbaniaAlgeriaArgentinaAustraliaAustriaAzerbaijanBahamas, TheBahrainBangladeshBarbadosBelarusBelgiumBelizeBeninBoliviaBosnia and HerzegovinaBotswanaBrazilBulgariaBurkina FasoBurundiCambodiaCameroonCanadaCentral African RepublicChileChinaColombiaCongo, Rep.Costa RicaCote d'IvoireCroatiaCubaCyprusCzech RepublicDenmarkDominican RepublicEcuadorEgypt, Arab Rep.El SalvadorEritreaEstoniaEthiopiaFijiFinlandFranceGabonGambia, TheGeorgiaGermanyGhanaGreeceGuatemalaHondurasHong Kong SAR, ChinaHungaryIcelandIndiaIndonesiaIran, Islamic Rep.IraqIrelandIsraelItalyJamaicaJapanJordanKazakhstanKenyaKorea, Rep.KuwaitKyrgyz RepublicLao PDRLatviaLebanonLesothoLibyaLithuaniaLuxembourgMacao SAR, ChinaMacedonia, FYRMadagascarMalawiMalaysiaMaltaMauritiusMexicoMoldovaMongoliaMoroccoMozambiqueNamibiaNepalNetherlandsNew ZealandNicaraguaNigerNigeriaNorwayOmanPakistanPanamaPapua New GuineaParaguayPeruPhilippinesPolandPortugalPuerto RicoQatarRomaniaRussian FederationRwandaSaudi ArabiaSenegalSerbiaSierra LeoneSingaporeSlovak RepublicSloveniaSomaliaSouth AfricaSpainSri LankaSt. LuciaSudanSwazilandSwedenSwitzerlandSyrian Arab RepublicTanzaniaThailandTongaTrinidad and TobagoTunisiaTurkeyUgandaUkraineUnited Arab EmiratesUnited KingdomUnited StatesUruguayVenezuela, RBVietnamWest Bank and GazaYemen, Rep.Zambia Timeline:
This timeline shows a graph from 1989 to 2014 of Romania. No data until 1988. Number of actual observations by date: 26.
Source name:
World Development Indicators
Source organization:
United Nations Industrial Development Organization, International Yearbook of Industrial Statistics.
Categories, topics:
Economy & Growth
Last updated:
apr 23, 2017
Indicators value changes by year
Minimum:
12.944
jan 1, 2005
Maximum:
35.217
jan 1, 1998
At the date of observation
Value
Absolute change
Change from previous value
jan 1, 1989
13.624
+13.624
0.0%
jan 1, 1990
15.457
+1.833
13.46%
jan 1, 1991
20.251
+4.794
31.02%
jan 1, 1992
19.322
-0.929
-4.59%
jan 1, 1993
22.096
+2.774
14.36%
jan 1, 1994
26.409
+4.312
19.52%
jan 1, 1995
25.761
-0.648
-2.45%
jan 1, 1996
28.405
+2.644
10.27%
jan 1, 1997
30.59
+2.185
7.69%
jan 1, 1998
35.217
+4.627
15.13%
jan 1, 1999
29.0
-6.217
-17.65%
jan 1, 2000
30.408
+1.408
4.85%
jan 1, 2001
31.532
+1.124
3.7%
jan 1, 2002
32.839
+1.307
4.14%
jan 1, 2003
29.352
-3.486
-10.62%
jan 1, 2004
14.003
-15.35
-52.29%
jan 1, 2005
12.944
-1.058
-7.56%
jan 1, 2006
15.798
+2.854
22.05%
jan 1, 2007
16.071
+0.273
1.73%
jan 1, 2008
16.192
+0.121
0.75%
jan 1, 2009
14.908
-1.284
-7.93%
jan 1, 2010
18.515
+3.607
24.19%
jan 1, 2011
17.528
-0.987
-5.33%
jan 1, 2012
15.175
-2.353
-13.42%
jan 1, 2013
14.559
-0.616
-4.06%
jan 1, 2014
15.548
+0.989
6.79%
Ranking of countries by current statistics by years


Comments: