29
/
en
AIzaSyAYiBZKx7MnpbEhh9jyipgxe19OcubqV5w
April 1, 2024
262223
Thailand
THA
true
2
1
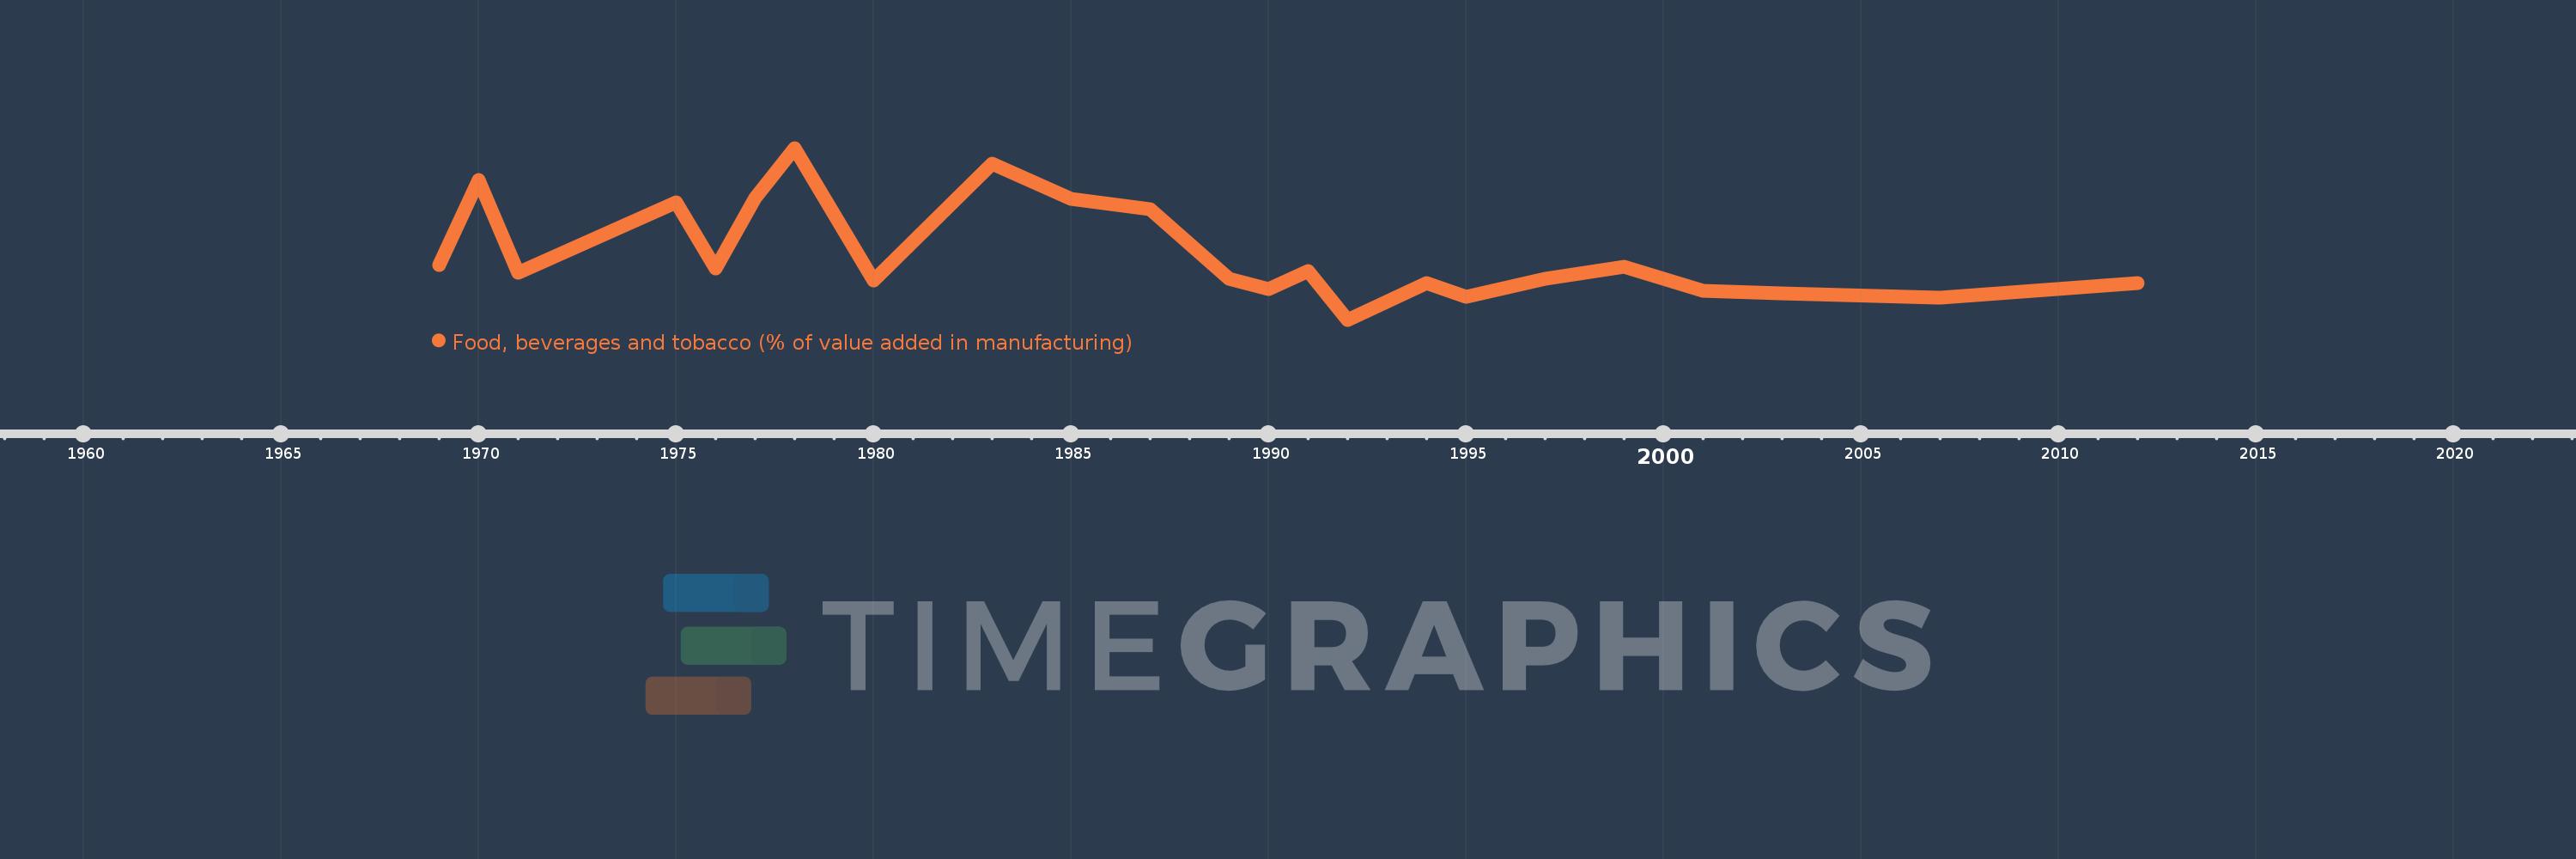
Food, beverages and tobacco (% of value added in manufacturing)
2012,2007,2003,2001,1999,1997,1995,1994,1992,1991,1990,1989,1987,1985,1983,1980,1978,1977,1976,1975,1971,1970,1969
This statistics in other country:
AlbaniaAlgeriaArgentinaAustraliaAustriaAzerbaijanBahamas, TheBahrainBangladeshBarbadosBelarusBelgiumBelizeBeninBoliviaBosnia and HerzegovinaBotswanaBrazilBulgariaBurkina FasoBurundiCambodiaCameroonCanadaCentral African RepublicChileChinaColombiaCongo, Rep.Costa RicaCote d'IvoireCroatiaCubaCyprusCzech RepublicDenmarkDominican RepublicEcuadorEgypt, Arab Rep.El SalvadorEritreaEstoniaEthiopiaFijiFinlandFranceGabonGambia, TheGeorgiaGermanyGhanaGreeceGuatemalaHondurasHong Kong SAR, ChinaHungaryIcelandIndiaIndonesiaIran, Islamic Rep.IraqIrelandIsraelItalyJamaicaJapanJordanKazakhstanKenyaKorea, Rep.KuwaitKyrgyz RepublicLao PDRLatviaLebanonLesothoLibyaLithuaniaLuxembourgMacao SAR, ChinaMacedonia, FYRMadagascarMalawiMalaysiaMaltaMauritiusMexicoMoldovaMongoliaMoroccoMozambiqueNamibiaNepalNetherlandsNew ZealandNicaraguaNigerNigeriaNorwayOmanPakistanPanamaPapua New GuineaParaguayPeruPhilippinesPolandPortugalPuerto RicoQatarRomaniaRussian FederationRwandaSaudi ArabiaSenegalSerbiaSierra LeoneSingaporeSlovak RepublicSloveniaSomaliaSouth AfricaSpainSri LankaSt. LuciaSudanSwazilandSwedenSwitzerlandSyrian Arab RepublicTanzaniaThailandTongaTrinidad and TobagoTunisiaTurkeyUgandaUkraineUnited Arab EmiratesUnited KingdomUnited StatesUruguayVenezuela, RBVietnamWest Bank and GazaYemen, Rep.Zambia Timeline:
This timeline shows a graph from 1969 to 2012 of Thailand. No data until 1968. Number of actual observations by date: 23.
Source name:
World Development Indicators
Source organization:
United Nations Industrial Development Organization, International Yearbook of Industrial Statistics.
Categories, topics:
Economy & Growth
Last updated:
apr 23, 2017
Indicators value changes by year
Maximum:
59.966
jan 1, 1978
At the date of observation
Value
Absolute change
Change from previous value
jan 1, 1969
25.516
+25.516
0.0%
jan 1, 1970
50.394
+24.878
97.5%
jan 1, 1971
23.07
-27.323
-54.22%
jan 1, 1975
43.912
+20.841
90.34%
jan 1, 1976
24.295
-19.616
-44.67%
jan 1, 1977
45.175
+20.88
85.94%
jan 1, 1978
59.966
+14.791
32.74%
jan 1, 1980
20.744
-39.222
-65.41%
jan 1, 1983
55.374
+34.63
166.94%
jan 1, 1985
44.98
-10.394
-18.77%
jan 1, 1987
41.808
-3.172
-7.05%
jan 1, 1989
21.315
-20.493
-49.02%
jan 1, 1990
18.43
-2.885
-13.53%
jan 1, 1991
23.727
+5.297
28.74%
jan 1, 1992
9.257
-14.47
-60.98%
jan 1, 1994
19.958
+10.701
115.59%
jan 1, 1995
16.101
-3.857
-19.33%
jan 1, 1997
21.43
+5.329
33.1%
jan 1, 1999
24.809
+3.379
15.77%
jan 1, 2001
17.699
-7.11
-28.66%
jan 1, 2003
17.103
-0.596
-3.37%
jan 1, 2007
15.696
-1.408
-8.23%
jan 1, 2012
19.966
+4.27
27.21%
Ranking of countries by current statistics by years


Comments: