29
/
en
AIzaSyAYiBZKx7MnpbEhh9jyipgxe19OcubqV5w
April 1, 2024
135504
Gabon
GAB
true
2
1
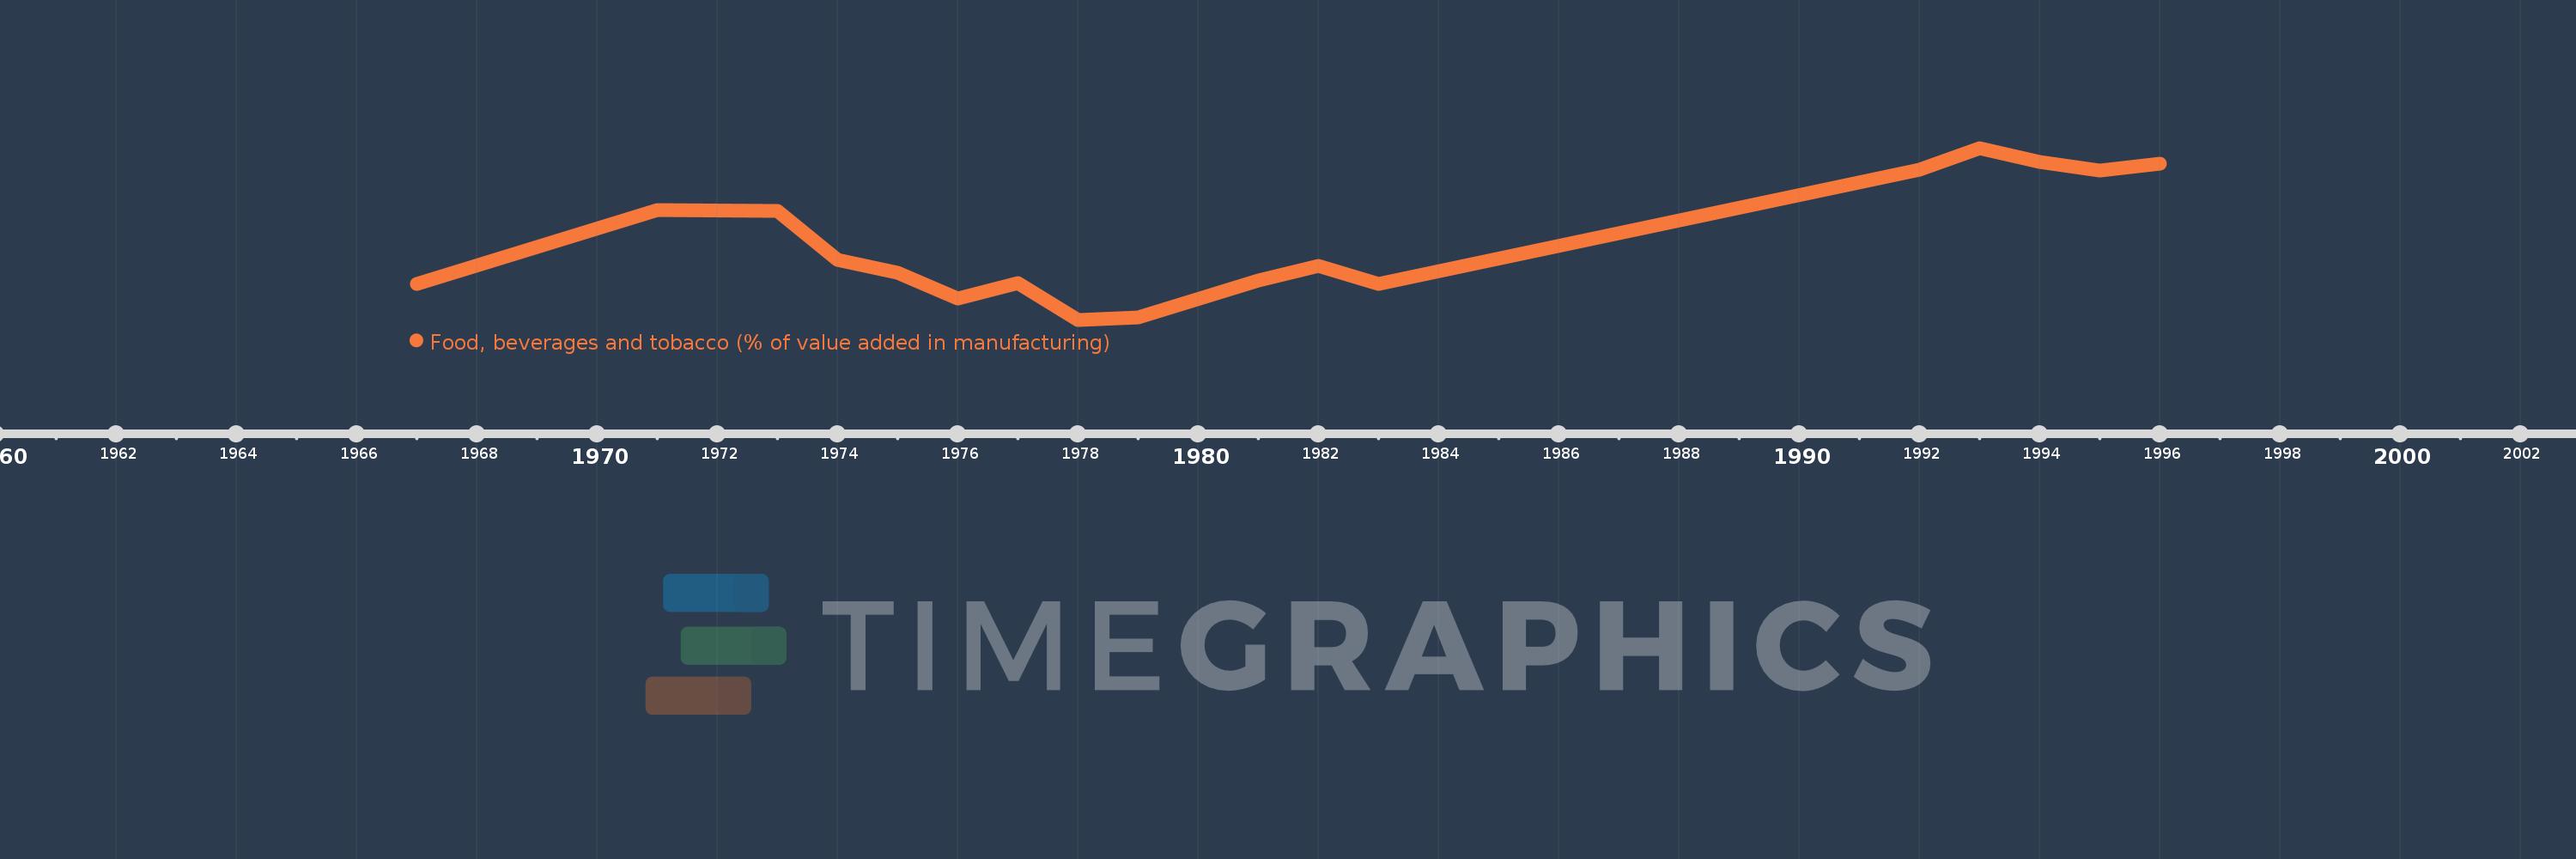
Food, beverages and tobacco (% of value added in manufacturing)
1996,1995,1994,1993,1992,1983,1982,1981,1979,1978,1977,1976,1975,1974,1973,1971,1967
This statistics in other country:
AlbaniaAlgeriaArgentinaAustraliaAustriaAzerbaijanBahamas, TheBahrainBangladeshBarbadosBelarusBelgiumBelizeBeninBoliviaBosnia and HerzegovinaBotswanaBrazilBulgariaBurkina FasoBurundiCambodiaCameroonCanadaCentral African RepublicChileChinaColombiaCongo, Rep.Costa RicaCote d'IvoireCroatiaCubaCyprusCzech RepublicDenmarkDominican RepublicEcuadorEgypt, Arab Rep.El SalvadorEritreaEstoniaEthiopiaFijiFinlandFranceGabonGambia, TheGeorgiaGermanyGhanaGreeceGuatemalaHondurasHong Kong SAR, ChinaHungaryIcelandIndiaIndonesiaIran, Islamic Rep.IraqIrelandIsraelItalyJamaicaJapanJordanKazakhstanKenyaKorea, Rep.KuwaitKyrgyz RepublicLao PDRLatviaLebanonLesothoLibyaLithuaniaLuxembourgMacao SAR, ChinaMacedonia, FYRMadagascarMalawiMalaysiaMaltaMauritiusMexicoMoldovaMongoliaMoroccoMozambiqueNamibiaNepalNetherlandsNew ZealandNicaraguaNigerNigeriaNorwayOmanPakistanPanamaPapua New GuineaParaguayPeruPhilippinesPolandPortugalPuerto RicoQatarRomaniaRussian FederationRwandaSaudi ArabiaSenegalSerbiaSierra LeoneSingaporeSlovak RepublicSloveniaSomaliaSouth AfricaSpainSri LankaSt. LuciaSudanSwazilandSwedenSwitzerlandSyrian Arab RepublicTanzaniaThailandTongaTrinidad and TobagoTunisiaTurkeyUgandaUkraineUnited Arab EmiratesUnited KingdomUnited StatesUruguayVenezuela, RBVietnamWest Bank and GazaYemen, Rep.Zambia Timeline:
This timeline shows a graph from 1967 to 1996 of Gabon. No data until 1966. Number of actual observations by date: 17.
Source name:
World Development Indicators
Source organization:
United Nations Industrial Development Organization, International Yearbook of Industrial Statistics.
Categories, topics:
Economy & Growth
Last updated:
apr 23, 2017
Indicators value changes by year
Minimum:
17.066
jan 1, 1978
At the date of observation
Value
Absolute change
Change from previous value
jan 1, 1967
23.615
+23.615
0.0%
jan 1, 1971
37.171
+13.556
57.4%
jan 1, 1973
37.044
-0.127
-0.34%
jan 1, 1974
28.02
-9.024
-24.36%
jan 1, 1975
25.701
-2.319
-8.28%
jan 1, 1976
21.035
-4.666
-18.16%
jan 1, 1977
23.858
+2.823
13.42%
jan 1, 1978
17.066
-6.792
-28.47%
jan 1, 1979
17.457
+0.391
2.29%
jan 1, 1981
24.35
+6.894
39.49%
jan 1, 1982
26.908
+2.557
10.5%
jan 1, 1983
23.605
-3.303
-12.28%
jan 1, 1992
44.683
+21.078
89.3%
jan 1, 1993
48.61
+3.928
8.79%
jan 1, 1994
46.009
-2.602
-5.35%
jan 1, 1995
44.385
-1.624
-3.53%
jan 1, 1996
45.773
+1.389
3.13%
Ranking of countries by current statistics by years


Comments: