29
/
en
AIzaSyAYiBZKx7MnpbEhh9jyipgxe19OcubqV5w
April 1, 2024
269735
Turkey
TUR
true
2
1
Net ODA received (% of central government expense)
2015,2014,2013,2012,2011,2010,2009,1999,1998,1997,1996,1995,1994,1993,1992,1991,1990,1989,1988,1987,1986,1985,1984,1982,1981,1980,1979,1978,1977,1976,1975,1974,1973
This statistics in other country:
AfghanistanAlbaniaAlgeriaAngolaAntigua and BarbudaArmeniaAzerbaijanBahamas, TheBahrainBangladeshBarbadosBelarusBelizeBeninBhutanBoliviaBosnia and HerzegovinaBotswanaBrazilBurkina FasoBurundiCabo VerdeCambodiaCentral African RepublicChileColombiaCongo, Dem. Rep.Congo, Rep.Costa RicaCote d'IvoireCroatiaCyprusDominicaDominican RepublicEgypt, Arab Rep.El SalvadorEquatorial GuineaEthiopiaFijiGambia, TheGeorgiaGhanaGrenadaGuatemalaHondurasIndiaIndonesiaIran, Islamic Rep.IraqIsraelJamaicaJordanKazakhstanKenyaKiribatiKorea, Rep.KuwaitKyrgyz RepublicLao PDRLebanonLesothoLiberiaMacao SAR, ChinaMacedonia, FYRMadagascarMalawiMalaysiaMaldivesMaliMaltaMauritiusMexicoMicronesia, Fed. Sts.MoldovaMongoliaMoroccoMozambiqueMyanmarNamibiaNepalNicaraguaNigeriaOmanPakistanPanamaPapua New GuineaParaguayPeruPhilippinesRwandaSamoaSao Tome and PrincipeSenegalSerbiaSeychellesSierra LeoneSingaporeSloveniaSolomon IslandsSouth AfricaSri LankaSt. Kitts and NevisSt. LuciaSurinameSwazilandSyrian Arab RepublicTajikistanTanzaniaThailandTimor-LesteTogoTrinidad and TobagoTunisiaTurkeyUgandaUkraineUruguayVanuatuVenezuela, RBVietnamWest Bank and GazaYemen, Rep.ZambiaZimbabwe Timeline:
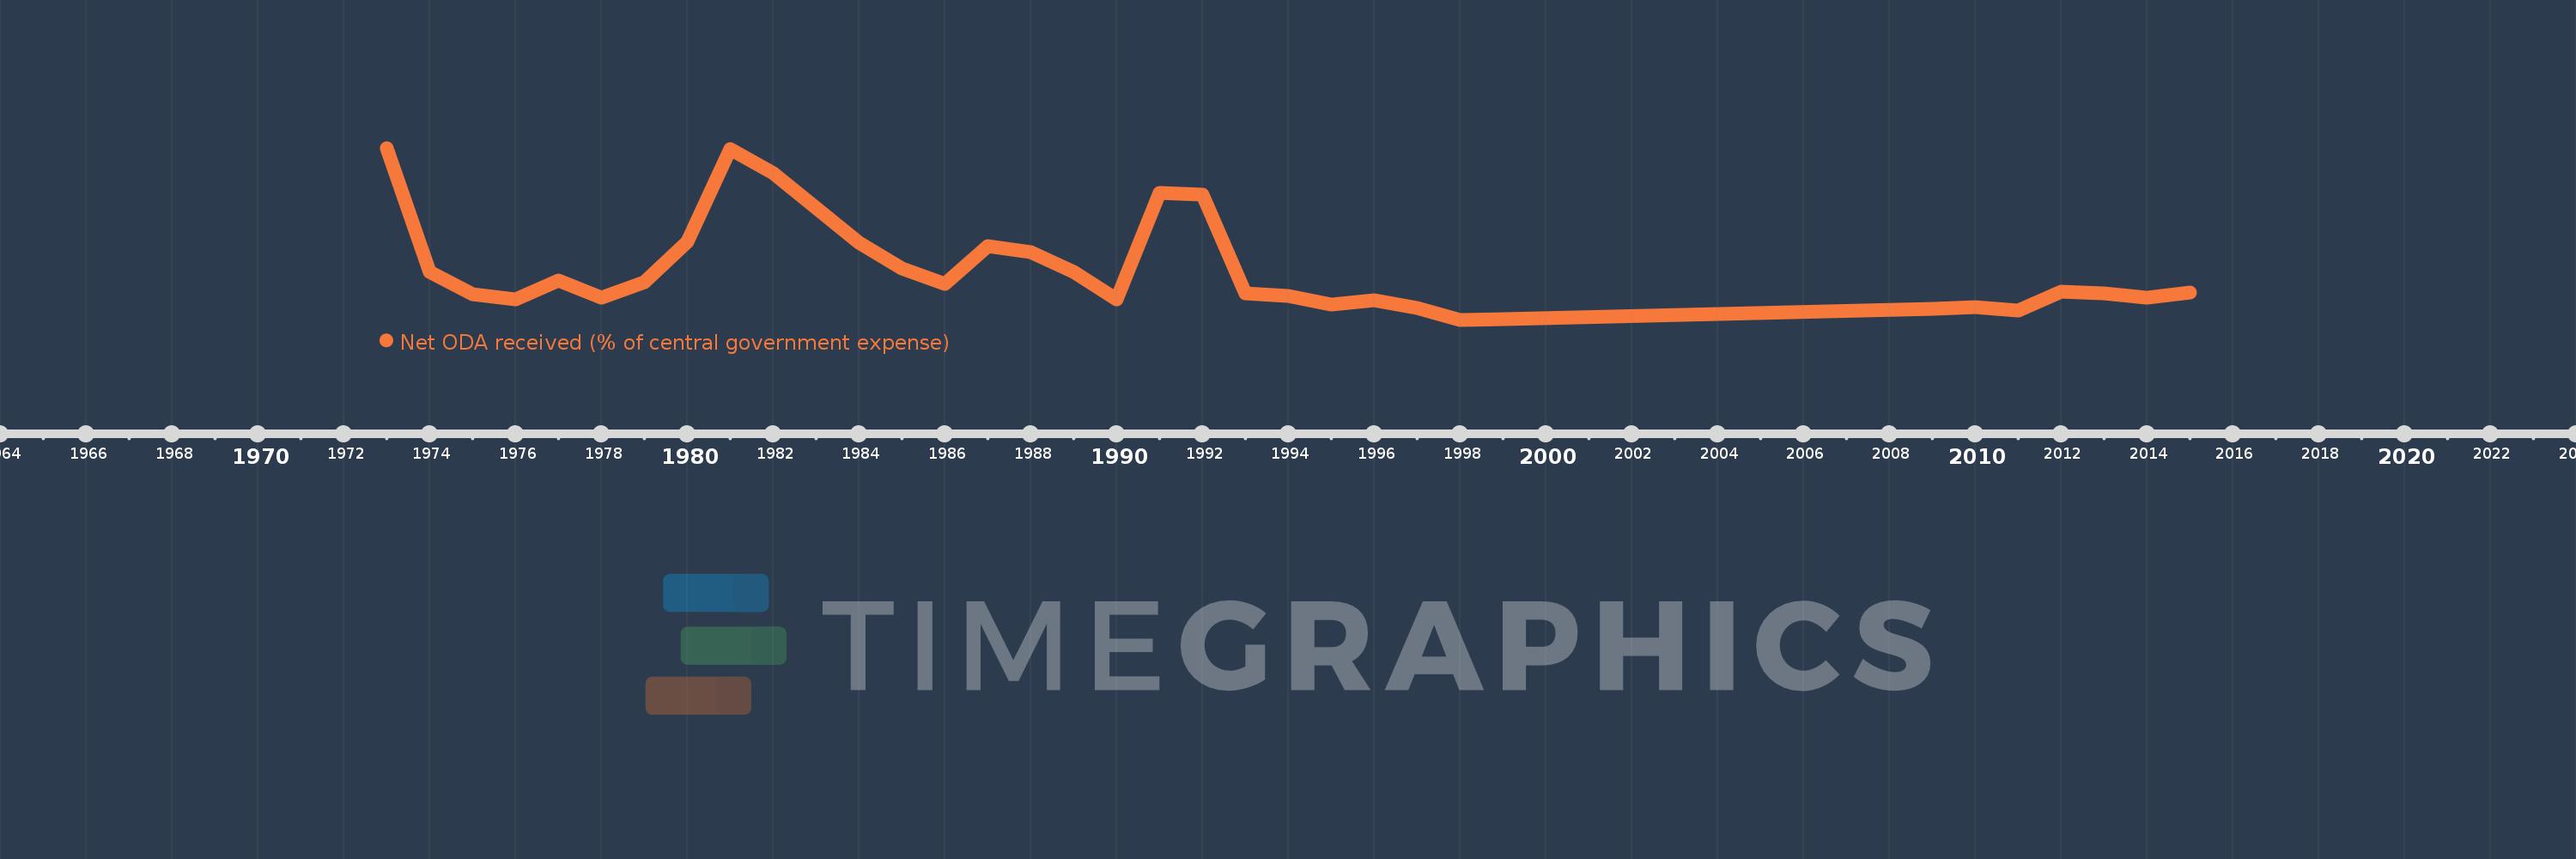
This timeline shows a graph from 1973 to 2015 of Turkey. No data until 1972. Number of actual observations by date: 33.
Source name:
World Development Indicators
Source organization:
Development Assistance Committee of the Organisation for Economic Co-operation and Development, Geographical Distribution of Financial Flows to Developing Countries, Development Co-operation Report, and International Development Statistics database. Data are available online at: www.oecd.org/dac/stats/idsonline. IMF central government expense estimates are used for the denominator.
Categories, topics:
Aid Effectiveness
Last updated:
apr 23, 2017
Indicators value changes by year
At the date of observation
Value
Absolute change
Change from previous value
jan 1, 1973
7.633
+7.633
0.0%
jan 1, 1974
2.129
-5.504
-72.1%
jan 1, 1975
1.148
-0.982
-46.1%
jan 1, 1976
0.921
-0.227
-19.74%
jan 1, 1977
1.746
+0.824
89.5%
jan 1, 1978
0.995
-0.75
-42.97%
jan 1, 1979
1.679
+0.683
68.65%
jan 1, 1980
3.486
+1.807
107.65%
jan 1, 1981
7.594
+4.108
117.85%
jan 1, 1982
6.508
-1.086
-14.3%
jan 1, 1984
3.444
-3.064
-47.08%
jan 1, 1985
2.286
-1.158
-33.63%
jan 1, 1986
1.601
-0.684
-29.94%
jan 1, 1987
3.284
+1.683
105.08%
jan 1, 1988
3.009
-0.275
-8.38%
jan 1, 1989
2.148
-0.861
-28.62%
jan 1, 1990
0.903
-1.245
-57.98%
jan 1, 1991
5.657
+4.755
526.82%
jan 1, 1992
5.58
-0.078
-1.37%
jan 1, 1993
1.192
-4.388
-78.64%
jan 1, 1994
1.081
-0.111
-9.28%
jan 1, 1995
0.688
-0.393
-36.32%
jan 1, 1996
0.88
+0.192
27.84%
jan 1, 1997
0.536
-0.344
-39.04%
jan 1, 1998
0.011
-0.525
-97.96%
jan 1, 1999
0.047
+0.036
324.8%
jan 1, 2009
0.489
+0.442
949.08%
jan 1, 2010
0.587
+0.099
20.19%
jan 1, 2011
0.404
-0.183
-31.18%
jan 1, 2012
1.274
+0.87
215.18%
jan 1, 2013
1.174
-0.1
-7.88%
jan 1, 2014
0.997
-0.177
-15.04%
jan 1, 2015
1.232
+0.235
23.59%
Ranking of countries by current statistics by years


Comments: