29
/
en
AIzaSyAYiBZKx7MnpbEhh9jyipgxe19OcubqV5w
April 1, 2024
91547
Brazil
BRA
true
2
1
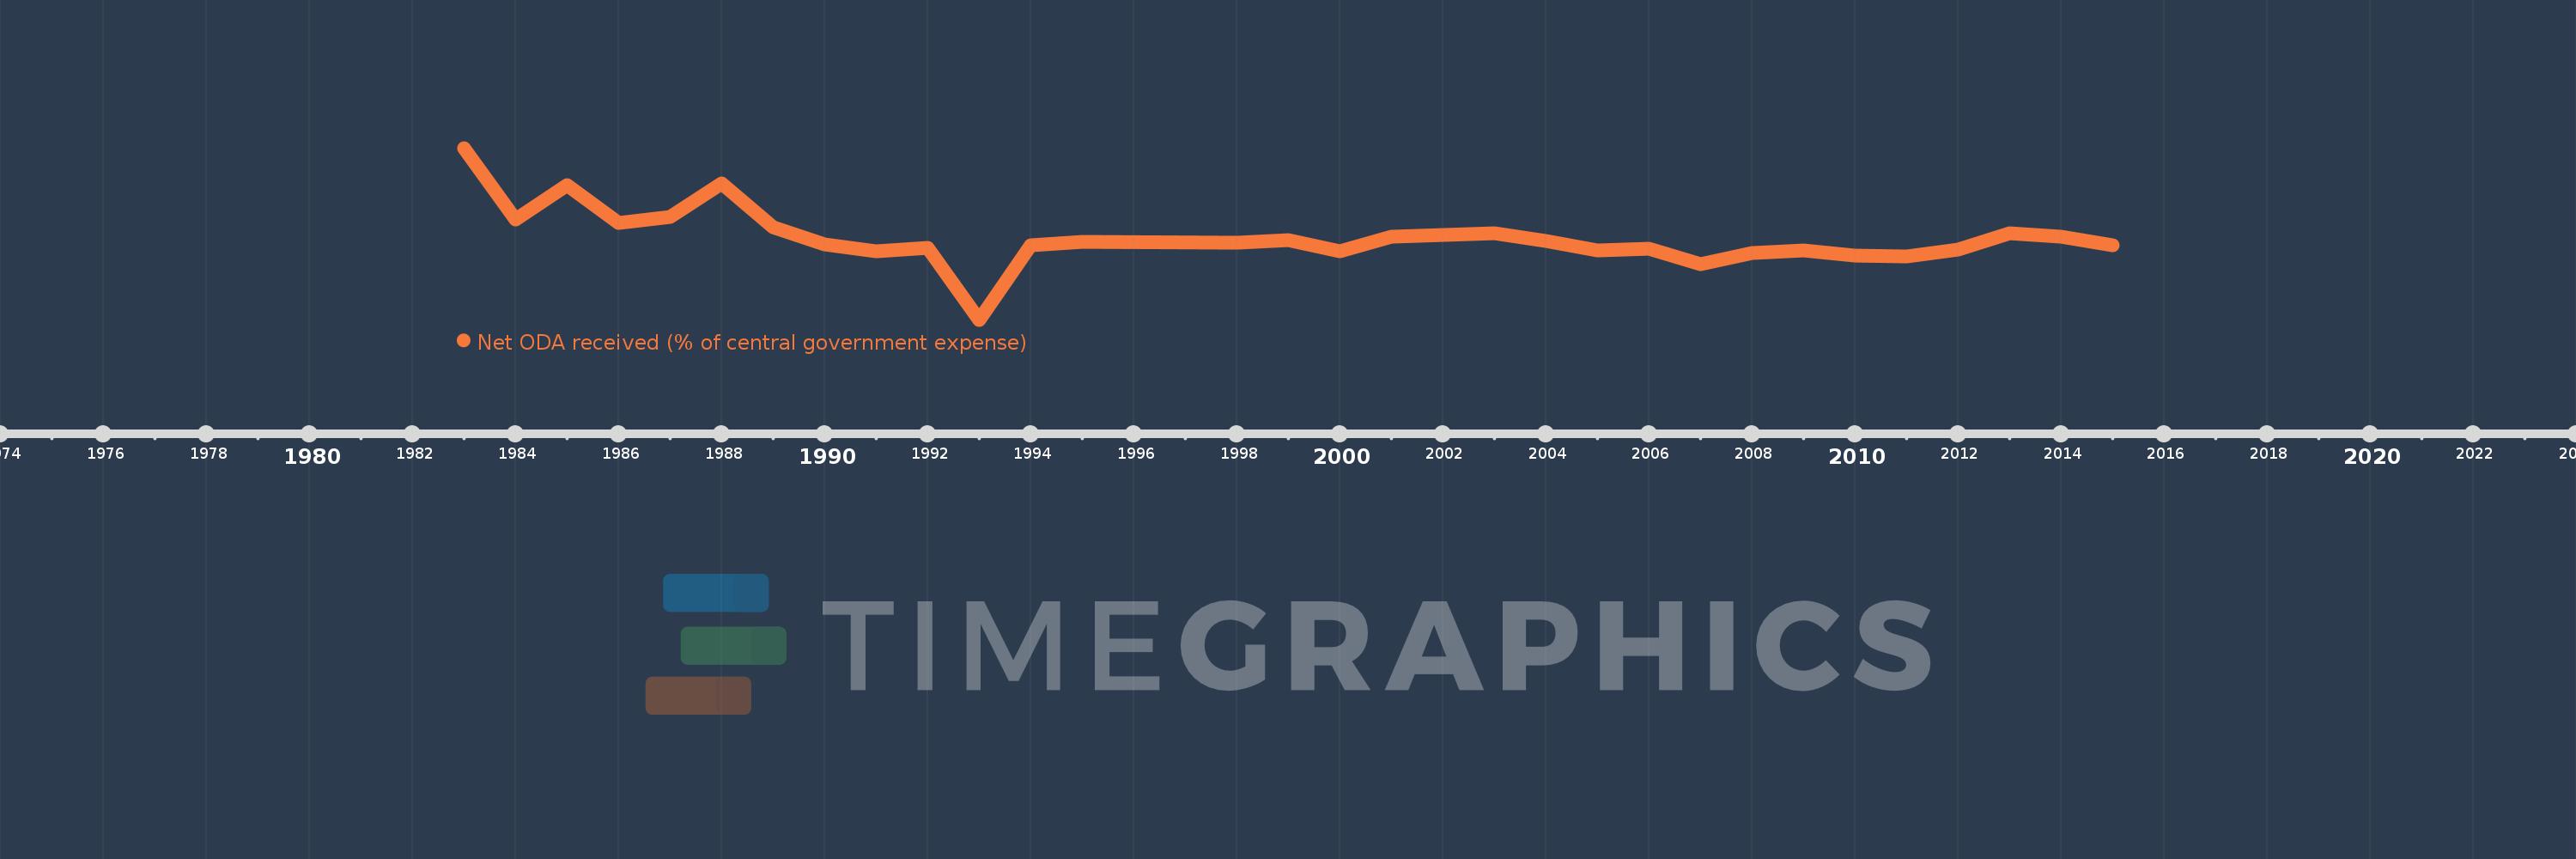
Net ODA received (% of central government expense)
2015,2014,2013,2012,2011,2010,2009,2008,2007,2006,2005,2004,2003,2002,2001,2000,1999,1998,1995,1994,1993,1992,1991,1990,1989,1988,1987,1986,1985,1984,1983
This statistics in other country:
AfghanistanAlbaniaAlgeriaAngolaAntigua and BarbudaArmeniaAzerbaijanBahamas, TheBahrainBangladeshBarbadosBelarusBelizeBeninBhutanBoliviaBosnia and HerzegovinaBotswanaBrazilBurkina FasoBurundiCabo VerdeCambodiaCentral African RepublicChileColombiaCongo, Dem. Rep.Congo, Rep.Costa RicaCote d'IvoireCroatiaCyprusDominicaDominican RepublicEgypt, Arab Rep.El SalvadorEquatorial GuineaEthiopiaFijiGambia, TheGeorgiaGhanaGrenadaGuatemalaHondurasIndiaIndonesiaIran, Islamic Rep.IraqIsraelJamaicaJordanKazakhstanKenyaKiribatiKorea, Rep.KuwaitKyrgyz RepublicLao PDRLebanonLesothoLiberiaMacao SAR, ChinaMacedonia, FYRMadagascarMalawiMalaysiaMaldivesMaliMaltaMauritiusMexicoMicronesia, Fed. Sts.MoldovaMongoliaMoroccoMozambiqueMyanmarNamibiaNepalNicaraguaNigeriaOmanPakistanPanamaPapua New GuineaParaguayPeruPhilippinesRwandaSamoaSao Tome and PrincipeSenegalSerbiaSeychellesSierra LeoneSingaporeSloveniaSolomon IslandsSouth AfricaSri LankaSt. Kitts and NevisSt. LuciaSurinameSwazilandSyrian Arab RepublicTajikistanTanzaniaThailandTimor-LesteTogoTrinidad and TobagoTunisiaTurkeyUgandaUkraineUruguayVanuatuVenezuela, RBVietnamWest Bank and GazaYemen, Rep.ZambiaZimbabwe Timeline:
This timeline shows a graph from 1983 to 2015 of Brazil. No data until 1982. Number of actual observations by date: 31.
Source name:
World Development Indicators
Source organization:
Development Assistance Committee of the Organisation for Economic Co-operation and Development, Geographical Distribution of Financial Flows to Developing Countries, Development Co-operation Report, and International Development Statistics database. Data are available online at: www.oecd.org/dac/stats/idsonline. IMF central government expense estimates are used for the denominator.
Categories, topics:
Aid Effectiveness
Last updated:
apr 23, 2017
Indicators value changes by year
Minimum:
-0.226
jan 1, 1993
At the date of observation
Value
Absolute change
Change from previous value
jan 1, 1983
0.582
+0.582
0.0%
jan 1, 1984
0.244
-0.339
-58.18%
jan 1, 1985
0.409
+0.165
67.79%
jan 1, 1986
0.229
-0.179
-43.91%
jan 1, 1987
0.257
+0.028
12.23%
jan 1, 1988
0.417
+0.159
61.98%
jan 1, 1989
0.21
-0.207
-49.61%
jan 1, 1990
0.13
-0.08
-38.19%
jan 1, 1991
0.096
-0.034
-26.3%
jan 1, 1992
0.114
+0.019
19.37%
jan 1, 1993
-0.226
-0.34
-297.87%
jan 1, 1994
0.125
+0.351
-155.34%
jan 1, 1995
0.14
+0.015
11.84%
jan 1, 1998
0.135
-0.005
-3.54%
jan 1, 1999
0.149
+0.014
10.65%
jan 1, 2000
0.095
-0.055
-36.61%
jan 1, 2001
0.165
+0.071
74.63%
jan 1, 2002
0.174
+0.009
5.2%
jan 1, 2003
0.181
+0.007
3.99%
jan 1, 2004
0.144
-0.037
-20.41%
jan 1, 2005
0.102
-0.042
-29.36%
jan 1, 2006
0.107
+0.006
5.76%
jan 1, 2007
0.037
-0.071
-65.76%
jan 1, 2008
0.086
+0.049
133.09%
jan 1, 2009
0.099
+0.014
15.93%
jan 1, 2010
0.077
-0.023
-22.81%
jan 1, 2011
0.071
-0.006
-7.72%
jan 1, 2012
0.106
+0.036
50.19%
jan 1, 2013
0.182
+0.076
70.99%
jan 1, 2014
0.163
-0.019
-10.5%
jan 1, 2015
0.126
-0.037
-22.7%
Ranking of countries by current statistics by years


Comments: