29
/
en
AIzaSyAYiBZKx7MnpbEhh9jyipgxe19OcubqV5w
April 1, 2024
102787
Central African Republic
CAF
true
2
1
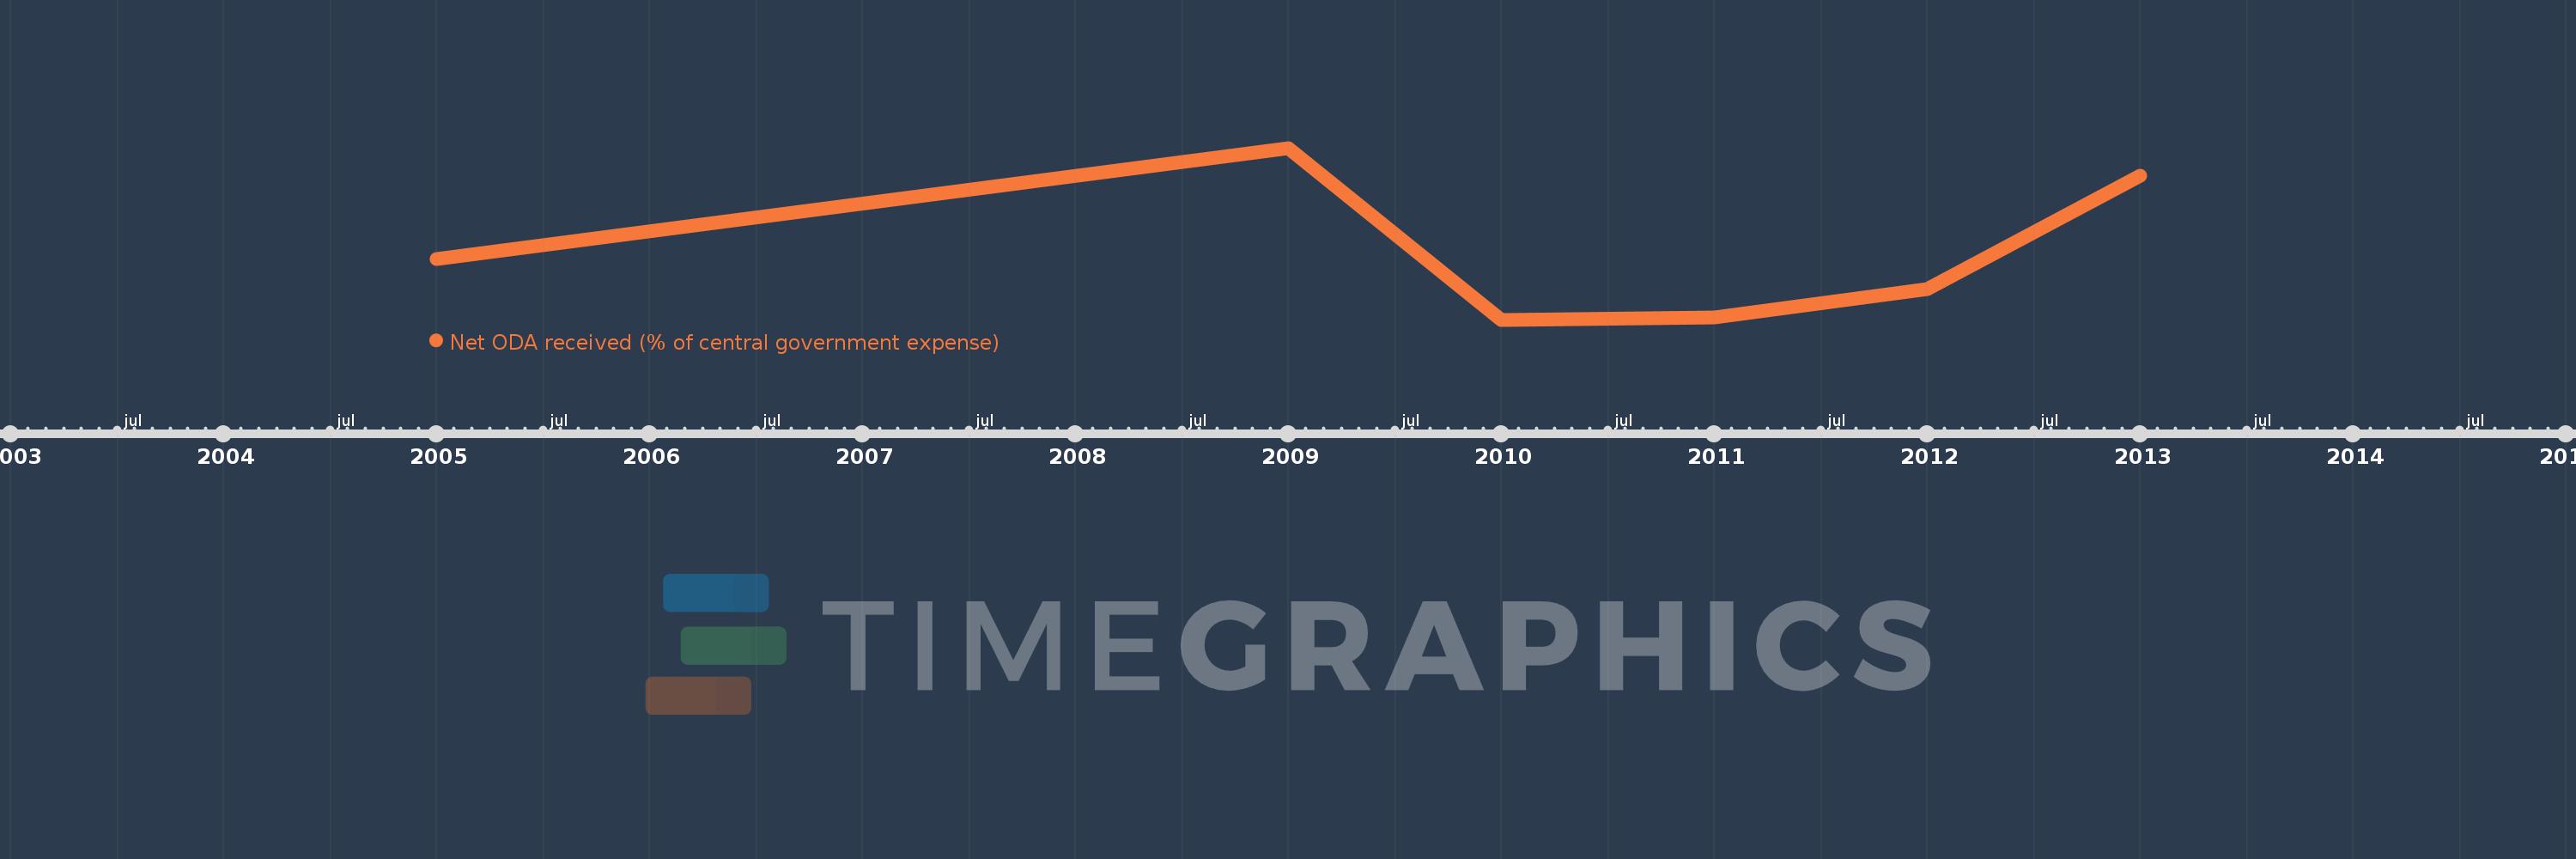
Net ODA received (% of central government expense)
2013,2012,2011,2010,2009,2005
This statistics in other country:
AfghanistanAlbaniaAlgeriaAngolaAntigua and BarbudaArmeniaAzerbaijanBahamas, TheBahrainBangladeshBarbadosBelarusBelizeBeninBhutanBoliviaBosnia and HerzegovinaBotswanaBrazilBurkina FasoBurundiCabo VerdeCambodiaCentral African RepublicChileColombiaCongo, Dem. Rep.Congo, Rep.Costa RicaCote d'IvoireCroatiaCyprusDominicaDominican RepublicEgypt, Arab Rep.El SalvadorEquatorial GuineaEthiopiaFijiGambia, TheGeorgiaGhanaGrenadaGuatemalaHondurasIndiaIndonesiaIran, Islamic Rep.IraqIsraelJamaicaJordanKazakhstanKenyaKiribatiKorea, Rep.KuwaitKyrgyz RepublicLao PDRLebanonLesothoLiberiaMacao SAR, ChinaMacedonia, FYRMadagascarMalawiMalaysiaMaldivesMaliMaltaMauritiusMexicoMicronesia, Fed. Sts.MoldovaMongoliaMoroccoMozambiqueMyanmarNamibiaNepalNicaraguaNigeriaOmanPakistanPanamaPapua New GuineaParaguayPeruPhilippinesRwandaSamoaSao Tome and PrincipeSenegalSerbiaSeychellesSierra LeoneSingaporeSloveniaSolomon IslandsSouth AfricaSri LankaSt. Kitts and NevisSt. LuciaSurinameSwazilandSyrian Arab RepublicTajikistanTanzaniaThailandTimor-LesteTogoTrinidad and TobagoTunisiaTurkeyUgandaUkraineUruguayVanuatuVenezuela, RBVietnamWest Bank and GazaYemen, Rep.ZambiaZimbabwe Timeline:
This timeline shows a graph from 2005 to 2013 of Central African Republic. No data until 2004. Number of actual observations by date: 6.
Source name:
World Development Indicators
Source organization:
Development Assistance Committee of the Organisation for Economic Co-operation and Development, Geographical Distribution of Financial Flows to Developing Countries, Development Co-operation Report, and International Development Statistics database. Data are available online at: www.oecd.org/dac/stats/idsonline. IMF central government expense estimates are used for the denominator.
Categories, topics:
Aid Effectiveness
Last updated:
apr 23, 2017
Indicators value changes by year
Minimum:
74.093
jan 1, 2010
Maximum:
117.742
jan 1, 2009
At the date of observation
Value
Absolute change
Change from previous value
jan 1, 2005
89.503
+89.503
0.0%
jan 1, 2009
117.742
+28.239
31.55%
jan 1, 2010
74.093
-43.649
-37.07%
jan 1, 2011
74.635
+0.543
0.73%
jan 1, 2012
81.989
+7.354
9.85%
jan 1, 2013
110.61
+28.62
34.91%
Ranking of countries by current statistics by years


Comments: